APPLIED INDUSTRIAL CONTROL SOLUTIONS
ApICS LLC
Air-Propelled People-Mover Vehicle
Speed Control System Analysis & Design
Brian T. Boulter
© ApICS ® LLC 2000
ABSTRACT
A computer model of a proposed air-propelled people-mover vehicle project in Florida is developed and a control system for controlling Vehicle speed is presented. Computer models were developed for the Vehicle dynamics, PPU (Propulsion Power Unit) blower characteristics, and air duct pressure. Also included are simulations of performance on hills, and the use of valve angle control and on-board Vehicle static braking systems for speed trim during deceleration. Fan motor torque calculations are included to provide information on expected torque loading and for calculating resulting stresses to the fan blades during normal operation.
INTRODUCTION
Scope
This report presents the results of simulating the Air-propelled people-mover Vehicle propulsion and control system. Computer models were developed for the Vehicle dynamics, blower characteristics, valve characteristics, on-board Vehicle braking systems, and air duct pressure. The purpose of the study is to identify a control strategy for automating the regulation of Vehicle speed, and provide guidelines for Vehicle positioning methods at stations. The goal is to negate the need for an operator while providing a comfortable ride for the passengers. Another goal of the report is to identify the dynamics of dual push/pull PPU systems, especially with respect to large changes in Vehicle loading, and non-level terrain.
Report Overview
This report contains detailed descriptions of the first principal equations used to describe the people mover Vehicle, PPU’s, Propulsion Duct, and the proposed regulators using the PPU’s planned for use in the Florida installation. The model detail is adequate enough to facilitate the identification of a proposed control strategy that is hoped will provide a fairly simple and easy to start-up control solution for regulating Vehicle speed in these applications.
The control solution presented in the simulation is implemented with fully functional Simulink S-Function models of existing Distributed Control System (DCS) blocks. The S-Functions were designed to reflect the behavior of a DCS control solution, they use the same difference equations that are used in DCS Blocks. The simulation is therefore truly dual mode, with the plant simulated using continuous mode models, and the controllers simulated using discrete mode models. The resulting hybrid simulation is able to accurately model the effects of sample time and algorithm computation times on control loop phase margin. The DCS representation also includes programmed limiting and clamping functions that limit the response of sub-systems to those achievable in the real application. This makes the simulation results more reflective of the anticipated response of the control loops, than the overly optimistic results that would be obtained in a fully continuous model, without limits.
Sequencing has been included to model the proposed drive configuration during acceleration, run and deceleration. The sequencing is structured so that the Vehicle speed during acceleration and run is controlled through the force applied to the Vehicle sails with propulsion tube pressure via the PPU fan blower speeds. During deceleration the Vehicle speed is controlled with both the brakes on the Vehicle and the duct pressure, which is regulated by a valve aperture opening, rather than the fan speed.
The report is divided into 6 sections. The first section contains a table of contents, the list of illustrations, the abstract and this introduction. The second section (Chapter 1) contains a detailed overview of the design specifications for the project, vendor supplied descriptions of the equipment to be used, including motor characteristics, blower characteristics, valve characteristics, and Vehicle specifications. The third section (Chapter 2) contains descriptions of the principal equations describing the plant, and a functional description of the DCS blocks used in the design and simulation of the controllers. The fourth section (Chapter 3) contains a detailed functional description of the simulation block diagrams, and the feed-forward and feedback control strategies employed.
The fifth section (Chapter 4) contains simulation results for station to station runs under loading conditions varying from an empty Vehicle to a fully loaded Vehicle. The simulated runs are also performed for various terrain configurations. The results include plots of Vehicle reference and feedback speeds, Propulsion Duct pressures, PPU blower speeds, and PPU Blower shaft torques. The sixth section (Chapter 5) summarizes principal observations and presents a series of conclusions. Following is a more detailed description of the contents of the Results chapter.
Results
The results are presented as a series of plots for each run. For each run a description of the run is given, along with plots of Vehicle Speed [kph], Speed Reference [kph], , Blower Speed [rpm], Blower shaft torque [N m], and PPU and Propulsion Duct Pressures [psi]. Runs were performed for maximum Vehicle velocities of 80 [kph] (1500 [m] run), 50 [kph] (1000 [m] run), and 30 [kph] (600 [m] run). The following runs are presented for Vmax = 80 [kph]
- Station 1 to Station 2 (PPU 200 pushing), empty Vehicle, Flat grade. (no Brakes)
- Station 2 to Station 1 (PPU 200 pulling), empty Vehicle, Flat grade. (no Brakes)
- Station 1 to Station 2 (PPU 200 pushing), empty Vehicle, Flat grade.
- Station 2 to Station 1 (PPU 200 pulling), empty Vehicle, Flat grade.
- Station 1 to Station 2 (PPU 200 pushing), mid-load Vehicle, Flat grade
- Station 2 to Station 1 (PPU 200 pulling), mid-load Vehicle, Flat grade
- Station 1 to Station 2 (PPU 200 pushing), full Vehicle, Flat grade.
- Station 2 to Station 1 (PPU 200 pulling), full Vehicle, Flat grade.
- Station 1 to Station 2 (PPU 200 pushing, PPU70 pulling), empty Vehicle, Flat grade.
- Station 2 to Station 1 (PPU 200 pulling, PPU70 pushing), empty Vehicle, Flat grade.
- Station 1 to Station 2 (PPU 200 pushing, PPU70 pulling), mid-load Vehicle, Flat grade
- Station 2 to Station 1 (PPU 200 pulling, PPU70 pushing), mid-load Vehicle, Flat grade
- Station 1 to Station 2 (PPU 200 pushing, PPU70 pulling), full Vehicle, Flat grade.
- Station 2 to Station 1 (PPU 200 pulling, PPU70 pushing), full Vehicle, Flat grade.
- Station 1 to Station 2 (PPU 200 pushing), empty Vehicle, grade = 8.
- Station 1 to Station 2 (PPU 200 pushing, PPU70 pulling), mid-load Vehicle, grade = 8.
- Station 2 to Station 1 (PPU 200 pulling, PPU70 pushing), full Vehicle, grade = 8.
For Vmax = 50 [kph]
- Station 2 to Station 1 (PPU 200 pulling), empty Vehicle, Flat grade.
- Station 1 to Station 2 (PPU 200 pushing), mid-load Vehicle, Flat grade
- Station 2 to Station 1 (PPU 200 pulling), full Vehicle, Flat grade.
- Station 1 to Station 2 (PPU 200 pushing, PPU70 pulling), empty Vehicle, Flat grade.
- Station 2 to Station 1 (PPU 200 pulling, PPU70 pushing), mid-load Vehicle, Flat grade
- Station 1 to Station 2 (PPU 200 pushing, PPU70 pulling), full Vehicle, Flat grade.
- Station 1 to Station 2 (PPU 200 pushing), empty Vehicle, grade = 8.
- Station 1 to Station 2 (PPU 200 pushing, PPU70 pulling), mid-load Vehicle, grade = 8.
- Station 2 to Station 1 (PPU 200 pulling, PPU70 pushing), full Vehicle, grade = 8.
For Vmax = 30 [kph]
- Station 2 to Station 1 (PPU 200 pulling), empty Vehicle, Flat grade.
- Station 1 to Station 2 (PPU 200 pushing), mid-load Vehicle, Flat grade
- Station 2 to Station 1 (PPU 200 pulling), full Vehicle, Flat grade.
- Station 1 to Station 2 (PPU 200 pushing, PPU70 pulling), empty Vehicle, Flat grade.
- Station 2 to Station 1 (PPU 200 pulling, PPU70 pushing), mid-load Vehicle, Flat grade
- Station 1 to Station 2 (PPU 200 pushing, PPU70 pulling), full Vehicle, Flat grade.
- Station 1 to Station 2 (PPU 200 pushing), empty Vehicle, grade = 8.
- Station 1 to Station 2 (PPU 200 pushing, PPU70 pulling), mid-load Vehicle, grade = 8.
- Station 2 to Station 1 (PPU 200 pulling, PPU70 pushing), full Vehicle, grade = 8.
Assumptions
The following assumptions were made:
- Before the speed control scheme is enabled, the Vehicle mass for a given run is computed with an accuracy of +/- 5%.
- All stiction and/or drive train backlash in coupled motor shafts, Vehicle brakes, and valves are negligible.
- The torsional stiffness of the PPU drive train is significantly high enough such that torsional resonance phenomena are not excited by the desired responsiveness (bandwidths) of the fan speed loops.
- There are no vibrational modes in the PPU structure that are significantly low enough in frequency to limit the response of the Blower speed loop.
- The frictional loss associated with the Vehicle motion on steel tracks is negligible.
- Pressure drops in the propulsion tube, which are a function of Vehicle distance from the PPU, are negligible.
- Pressure drops at bends in the Propulsion Duct, and in the PPU exit ducting are negligible.
- Pressure drops across fully open valves are negligible.
- Turbulence in the propulsion and PPU ducting will not significantly impact pressure loop performance.
- The speed feedback from the Blower motors are synchronized with the Fan speed loop data acquisition tasks.
- The Blower speed feedback device has no significant lag associated with the feedback reading (i.e. a corner frequency greater than 100 [rad/sec])
- The pressure transducers are located in such a way that any and all turbulence in the ducting will not adversely impact pressure feedback readings.
- The pressure transducers have no significant lag associated with the feedback reading (i.e. a corner frequency greater than 20 [rad/sec])
- The speed feedback from the Vehicle is received via radio transmission within a 50 [msec] window, and is synchronized with the Vehicle speed loop data acquisition tasks.
- The Vehicle speed feedback device has no significant lag associated with the feedback reading (i.e. a corner frequency greater than 100 [rad/sec])
There may be other assumptions that are implied and not expressed. These assumptions result from the use of linear equations to model non-linear phenomena.
Model Overview
The computer model is generated using first principal equations obtained from standard engineering and physics texts dealing with the subject matter [3,4,5,6], along with equations developed for an ApICS engineering course in "Advanced Dynamic Simulation" [7] created by the Author and H. Fox for systems modeling enthusiasts.
Tradeoffs between simulation complexity, simulation run times, and the detail required to obtain a satisfactory approximation of the expected Vehicle speed response, resulted in the author making the assumptions listed previously. In Chapter 2, and 3, these assumptions are explained in greater detail as needed.
CHAPTER 1
Design Requirements
This section of the report describes the nomenclature used in the description of the plant and control schemes, along with the design requirements and constraints supplied by the O.E.M.
Nomenclature
The following Nomenclature is employed throughout the report:
|
PPUX |
= PPU Blower (Fan) of type X |
|
FX |
= Force (X) [N] |
|
PX |
= Pressure (X) [Pa] |
|

|
= generic pressure rise/drop [Pa] |
|

|
= generic discharge flow [kg/sec] |
|
D
PV |
= valve pressure drop ( Pa = N/m2 ) £
20,000 Pa, typical |
|
D
pV |
= valve pressure drop ( psi) = D
P / 6890 £
2.90 psi, typical |
|
r |
= air mass density ( kg/m3 ) = 1.2 kg/m3 = .075 lb/ft3 for air |
|
vair |
= air velocity ( m/s ) |
|
q |
= volume flow rate ( m3/s ) |
|
Q |
= volume flow rate ( m3/h ) = 3600 q |
|
AValve |
= valve cross-sectional flow area ( m2 ) |
|
K |
= valve pressure-loss coefficient (unit-less) |
|
PPPU |
= Pressure [Pa] at the exit of the PPU |
|
PFan |
= Pressure drop across the Blower |
|
PExit |
= Pressure drop across a partially closed valve |
|
N |
= Blower speed [rpm] |
|
c |
= Speed of sound in air (331 [m/s]) |
|
g |
= acceleration due to gravity (9.8 [m/s^2]) |
|
ADuct |
= Cross sectional area of the Propulsion Duct [m^2] |
|
V |
= Volume of the Propulsion Duct [m^3] |
|
vV |
= Vehicle velocity [m/s] |
|
vMax |
= Maximum Vehicle velocity [kph] |
|
vAVG |
= Average Vehicle velocity [m/s] |
|
vWind |
= Wind velocity [m/s] |
|
K |
= Valve constant |
|

|
= Mass flow of air in the Propulsion Duct [kg/sec] |
|

|
= Mass flow of air through the valve [kg/sec] |
|
Td(X) |
= Transport delay of PPUX [sec] |
|
MV |
= Vehicle + Payload mass [kg] |
|
CD |
= Drag co-efficient |
|
AD |
= Vehicle effective frontal area [m^2] |
|
m R |
= dynamic friction co-efficient |
|
aV |
= Vehicle acceleration rate [m/s^2] |
|
aMax |
= Desired maximum acc/deceleration rate [kph/s] |
|
SREF |
= Instantaneous Vehicle speed reference [kph] |
|
AREF |
= Instantaneous Vehicle speed derivative [kph/s] |
|
ACC_X |
= Feed-forward pressure for PPUX for acceleration [Pa] |
|
RUN_X |
= Feed-forward pressure for PPUX for run [Pa] |
|
DEC_X |
= Feed-forward pressure for PPUX for de-acceleration [Pa] |
|
STP_X |
= Feed-forward pressure for PPUX for stop [Pa] |
|
HI_V |
= A large fraction of to speed [kph] (user adjustable) |
|
LO_V |
= A small fraction of top speed [kph] (user adjustable) |
|
PREF_X |
= Feed-forward pressure reference for PPUX[Pa] |
|
KTd |
= User adjustable scalar for adaptive gain adjustment (default = 2) |
|
LENX |
= Distance from PPUX to Vehicle sail [m]. |
|
KPSX |
= PPUX Normalized PI speed loop gain |
|
KPSI |
= PPUX Instantaneous speed loop gain. |
|
WLDSX |
= PPUX Normalized PI speed loop lead frequency [rad/sec] |
|
WLDSi |
= PPUX Instantaneous PI speed loop lead frequency [rad/sec] |
|
w X |
= PPUX Normalized Vehicle speed loop bandwidth [rad/sec] (default = 2) |
|

|
= PPUX per-normal Fan speed (1 => Max [rpm]) |
|

|
= PPUX Normalized Vehicle mass [sec] |
|
Jm |
= Motor inertia [kg m^2] |
|

|
= PPUX Per-normal motor inertia [sec] |
|
Jf |
= Blower (fan) Inertia [kg m^2] |
|

|
= PPUX per-normal blower (fan) inertia [sec] |
|

|
= PPUX Total per-normal inertia [sec]  |
|
Ks |
= Approximate shaft stiffness [kg m^2/s^2] |
|
G |
= Acceleration due to gravity (32.2 ft / s^2) |
|
KNOISE |
= Approximate normalized noise contribution |
|
KPMAX |
= Approximate max possible PI proportional gain |
|
w CO(SPD) |
= Approximate fan-speed loop bandwidth [rad/sec] |
|
w T(X) |
= PPUX Approximate torsional frequency [rad/sec] |
|
WLDF_X |
= PPUX Fan-speed loop PI lead frequency [rad/sec] |
|
KPF_X |
= PPUX Fan-speed loop PI gain |
|
KPSB |
= Vehicle brake loop normalized PI speed loop gain |
|
WLDSB |
= Vehicle brake loop normalized PI speed loop lead frequency [rad/sec] |
|
w B |
= Vehicle brake loop bandwidth [rad/sec] (default = 10 [rad/sec]) |
|

|
= Low frequency gain term from SREF_X to PFB_X |
|

|
= PPU(X) plant (pressure) first order response pole [rad/sec] |
|

|
= PPU(X) blower speed loop bandwidth [rad/sec] |
|

|
= Low frequency gain term from PERR_X to PFB_X |
|
WLDV_X |
= PPU(X) Valve position loop PI lead frequency [rad/sec] |
|

|
= PPU(X) valve position loop bandwidth [rad/sec] |
|
w PLAG |
= PPU(X) forward path lag frequency [rad/sec] |
|
REFF(X) |
= PPUX effective fan radius [m] |
|

|
= PPUX motor maximum torque [Nm] |
|

|
= PPUX per-normal motor torque (1 => Max [Nm]) |
|

|
= Vehicle Brake time constant (1/3 [sec]) |
Design Documents/Specifications
The following documents were provided by Harry Fox - Consulting Engineer, ApICS, and the O.E.Ms.
- "<PROPRIETARY> – Performance Simulations", Report generated the O.E.M.
- "Simulation of the Vehicle Propulsion and Control System", Memo from Harry W. Fox.
- "Power Blowers – PPU", Memo from the PPU O.E.M.
From these documents the following data was extracted for use in the simulation:
PPU70 Data
PPU70 is a blower designed for use with a 300 [HP] motor. The following data was supplied by the PPU O.E.M., and used to describe the PPU70 Blower Characteristics in Chapter 2. The points in the table below are plotted and curve fitted in The Figure below.
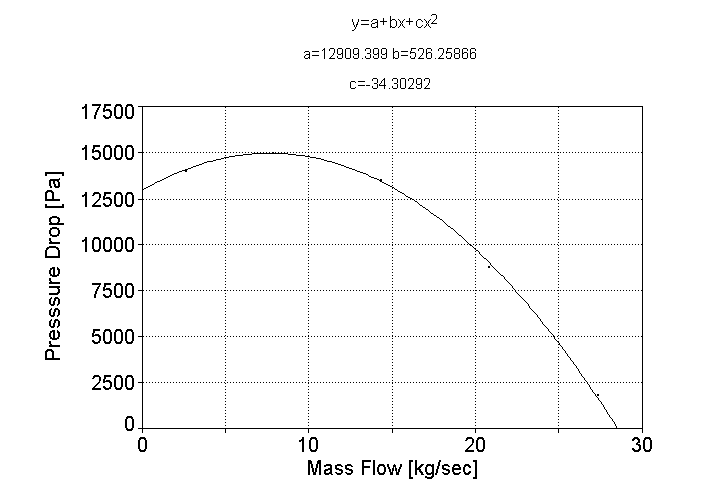
Figure 1. PPU70 Pressure Drop Curve Fit (1785 [rpm])
|
Point |
 [ACFM] [ACFM]
|
 [kg/sec] [kg/sec]
|
 [in Wg] [in Wg]
|
 [Pa] [Pa]
|
|
1 |
48203 |
27.30 |
14.18 |
3528 |
|
2 |
36726 |
20.80 |
39.37 |
9796 |
|
3 |
25249 |
14.3 |
56.11 |
13962 |
|
4 |
13772 |
7.8 |
60.80 |
15129 |
|
5 |
4591 |
2.60 |
56.27 |
14002 |
Additional Data Supplied by TLT Babcock and used in the simulation for PPU70 is tabulated below:
|
Specification |
Imperial Units |
SI Units |
|
Moment of Inertia |
2900 [lb ft^2] |
122 [kg-m^2] |
|
Fan Max Speed |
1785 [rpm] |
1785 [rpm] |
|
Normal inlet density |
0.0652 [lb/acf] |
1.044 [kg/m^3] |
|
Normal power req. @ Max. PT - Inlet open |
321 [HP] |
239 [Kw] |
|
Normal Fan Torque @ Max. PT- Inlet open |
944 [ft lb] |
1281 [Nm] |
|
Normal power req. @ Start-up - Inlet closed |
106 [HP] |
79 [Kw] |
|
Normal power req. @ Start-up - Inlet closed |
312 [HP] |
423 [Kw] |
PPU200 Data
PPU200 is a blower designed for use with a 500 – 600 [HP] motor. The following data was supplied by the PPU O.E.M., and used to describe the PPU200 Blower Characteristics in Chapter 2. The points in the table below are plotted and curve fitted in The Figure below.

Figure 2. PPU 200 Pressure Drop Curve Fit (1785 [rpm])
|
Point |
 [ACFM] [ACFM]
|
 [kg/sec] [kg/sec]
|
 [in Wg] [in Wg]
|
 [Pa] [Pa]
|
|
1 |
78782 |
44.62 |
15.09 |
3754 |
|
2 |
62196 |
35.23 |
39.59 |
9851 |
|
3 |
41464 |
23.48 |
59.61 |
14833 |
|
4 |
20732 |
11.74 |
67.46 |
16786 |
|
5 |
4147 |
2.35 |
65.32 |
16252 |
Additional Data Supplied by TLT Babcock and used in the simulation for PPU200 is tabulated below:
|
Specification |
Imperial Units |
SI Units |
|
Moment of Inertia |
5040 [lb ft^2] |
212 [kg-m^2] |
|
Fan Max Speed |
1785 [rpm] |
1785 [rpm] |
|
Normal inlet density |
0.0652 [lb/acf] |
1.044 [kg/m^3] |
|
Normal power req. @ Max. PT - Inlet open |
600 [HP] |
447 [Kw] |
|
Normal Fan Torque @ Max. PT- Inlet open |
1765 [ft lb] |
2394 [Nm] |
|
Normal power req. @ Start-up - Inlet closed |
198 [HP] |
148 [Kw] |
|
Normal power req. @ Start-up - Inlet closed |
583 [HP] |
790 [Kw] |
Propulsion Duct Data
For the simulation, the engineers at the O.E.M. indicated that the run lengths to be used in the simulation be long enough so that the Vehicle will have enough room to accelerate to the desired top speed, and decelerate to a full stop. A run length of 1500 [m] (approximately 1 mile) was found to be adequate for Vmax = 80 [kph], a run length of 1000 [m] was found to be adequate for Vmax = 50 [kph], and a run length of 600 [m] was found to be adequate for Vmax = 30 [kph]. In addition the as-designed Propulsion Duct has a cross sectional area of approximately 1 [m^2] therefore:
Dist = 1500 [m]. 1000 [m], 600 [m] (Vmax dependant).
A_T = 1 [m^2]
In the model, pressure drop in the Propulsion Duct was assumed to be negligible. In the final design, it is assumed that the Propulsion Duct air loss will be minimal and limited to a value that will not result in a significant difference between the results of the simulation and real data.
Motor Data
PPU70 will be driven by a 300 [HP] AC motor, PPU200 will be driven by a 500 [HP] AC motor. The following specifications apply to the motors:
500 [hp] Motor
<PROPRIETARY>
300 [hp] Motor
<PROPRIETARY>
Valve Data
<PROPRIETARY>
Vehicle Data
The Vehicle is a passive people mover device designed to operate within the following constraints:
Deadweight = 12300 [kg]
Vehicle capacity = 240 [pax] standing, 48 [pax] seated @ 62.5 [kg] each
= approximately 18000 [kg]
Vehicle crushload = 12300 + app. 18000 [kg] = 30300 [kg]
Cruise speed = 80 [kph]
Acceleration rate = 2.88 [kph/s] = 0.8 [m/s^2]
Deceleration rate = -3.5 [kph/s] = -0.97 [m/s^2]
Effective frontal area = 12 [m^2]
Drag co-efficient = approx. 0.6 (1.0 or worst case used in the simulation)
CHAPTER 2
PLANT Modeling
first principal Models
The first principal models presented below are based on fundamental fluid flow dynamic analysis texts. The majority of the equations were first presented in [1]. The additional equations covered in this report deal with the following:
- Modeling the PPU duct valves and the development of a two-drop pressure equation set that incorporates the valve models.
- Modeling the on-board Vehicle braking system.
- Modeling the dual PPU blower configuration, including the calculation of load torque.
Blower Model
A quadratic curve fit of the blower characteristic curve, converted into SI units and with the discharge represented in terms of mass flow [kg/sec], resulted in an equation of the form:

Where :
 = blower pressure rise [Pa] = blower pressure rise [Pa]
 = discharge flow [kg/sec] = discharge flow [kg/sec]
A normalized blower characteristic curve factors the blower speed (N [rpm]) into the quadratic equation as follows:

Thus the pressure drop across the blower is given by:

Based upon the data supplied by the PPU O.E.M., and presented in Chapter 1, for the PPU70 and PPU200 blowers, the following parameters were obtained:
PPU70:
a = 0.0040516 [Pa/rpm^2]
b = 0.295 [Pa/rpm (kg/s)]
c = -34.303 [Pa/(kg/s)^2]
PPU200:
a = 0.0049613 [Pa/rpm^2]
b = 0.119 [Pa/rpm (kg/s)]
c = -10.798 [Pa/(kg/s)^2]
Valve Model
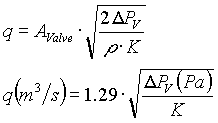
Based on data from Perry, Chemical Engineers’ Handbook, 5th Ed. the following suitable pressure drop equation for the shutter valves is presented. The following applies to butterfly valves, which exhibit dynamic behavior that is very similar to the shutter valves .
Let:
|

|
= generic pressure rise/drop [Pa] |
|

|
= generic discharge flow [kg/sec] |
|
D
PV |
= valve pressure drop ( Pa = N/m2 ) £
20,000 Pa, typical |
|
D
pV |
= valve pressure drop ( psi) = D
P / 6890 £
2.90 psi, typical |
|
r |
= air mass density ( kg/m3 ) = 1.2 kg/m3 = .075 lb/ft3 for air |
|
vair |
= air velocity ( m/s ) |
|
q |
= volume flow rate ( m3/s ) |
|
Q |
= volume flow rate ( m3/h ) = 3600 q |
|
AValve |
= valve cross-sectional flow area ( m2 ) |
|
K |
= valve pressure-loss coefficient (unit-less) |

 or or 
A convenient method of presenting data for these types of valves is to graph the magnitude of 1/Ö
K verses aperture opening. For a butterfly valve the following applies:
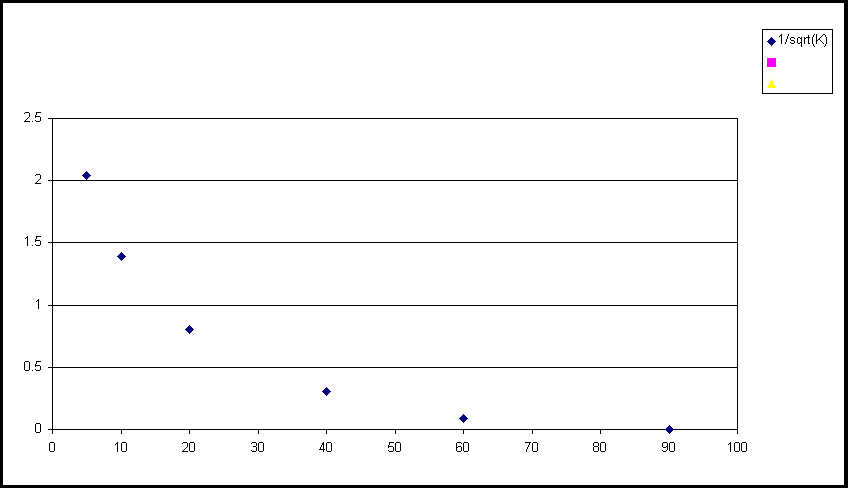
Figure 3. Graph of 1/Ö
K Vs degrees (0 = open, 90 = closed)
|
Degrees |
0 |
5 |
10 |
20 |
40 |
60 |
90 |
|
1/sqrt(K) |
2.5 (est) |
2.0 |
1.4 |
0.81 |
0.30 |
.092 |
0 |
PPU Pressure equations
Incorporating the equations for the blower characteristics and the valves is accomplished with the following set of pressure summation equations. It is assumed that there are two operating modes (a more detailed description of these modes with illustrations can be found in Chapter 3 in the section describing the Fan and Propulsion Duct computer models): The first is used during acceleration and run, the second is used during deceleration. Ignoring the pressure losses in the propulsion tunnel, the pressure drop associated with the turbulence that occurs when air travels around bends in the ducting, and the small pressure drop across fully open valves, the following equations apply:
1) When simulating during the first mode (acceleration and run) the following equations apply:
Let:
|
PPPU |
= Pressure [Pa] at the exit of the PPU |
|
PFan |
= Pressure drop across the Blower |
|
PExit |
= Pressure drop across a partially closed valve |
|
N |
= Blower speed [rpm] |
|
c |
= Speed of sound in air (331 [m/s]) |
|
r |
= Density of air [kg/m^3] |
|
ADuct |
= Cross sectional area of the Propulsion Duct [m^2] |
|
V |
= Volume of the Propulsion Duct [m^3] |
|
vVehicle |
= Vehicle velocity [m/s] |
|
K |
= Valve constant |
|

|
= Mass flow of air in the Propulsion Duct [kg/sec] |
|

|
= Mass flow of air through the valve [kg/sec] |

2) When simulating the second mode (deceleration) the following equations apply:
 ; ; 

Propulsion Duct Model
The Propulsion Duct is modeled as an ideal transport lag, i.e. the pressure PPPU(Push) at the push side Vehicle sail is equal to the Propulsion Duct inlet pressure delayed in time by an amount Td(Push) [sec]. This time delay will get larger as the Vehicle moves away from the PPU. Similarly the pressure PPPU(Pull) at the pull side Vehicle sail is equal to the Propulsion Duct inlet pressure delayed in time by an amount Td(Pull) [sec]. This time delay will get smaller as the Vehicle moves towards the PPU. It is clear that this delay is not constant. It is equal to the Vehicle distance from the PPU divided by the speed of sound in air (c=331 [m/s]). The Vehicle distance from the PPU is equal to the integral of Vehicle speed (vVehicle [m/s]) plus an initial condition (DIC [m]), therefore:

For a given run, the pushing PPU will see an increasing value, while the pulling PPU will see a decreasing value. This implies that care must be taken to ensure that, in the simulation, the correct sign is used for the Vehicle velocity when the integration is performed.
Vehicle Dynamic Model
The Vehicle of mass MV, subjected to a net force FNET, will accelerate according to Newton’s second law of motion:

The net force consists of an applied force FA in the direction of motion, due to the pressure in the Propulsion Duct on the Vehicle sails, and a net frictional force FR in the opposite direction of motion. FR is composed of the rolling friction of the wheels on the tracks, any forces applied by braking systems, and the drag of the Vehicle through the air.
The applied propulsion force FA equals the Propulsion Duct Area ADuct times the pressure difference across the sails in the Propulsion Duct at the front and back of the Vehicle.
The rolling frictional force equals the co-efficient of rolling friction times the normal force of the tracks on the Vehicle, (assume mR = 0.002 – steel on steel).
The air frictional force equals the drag co-efficient CD times the frontal area of the Vehicle AD times the dynamic pressure pvVehicle2/2; Assume CD = 1 (worst case), then:

To determine the required pressure difference across the Vehicle sails to accelerate a given Vehicle mass, the following equation can be used:

Note that an average velocity should be used to approximate the force needed to overcome drag forces. Combining the above equations, and letting DP = the sum of the two PPU pressures, the following Vehicle dynamic equation results:

If we include the equations for moving the Vehicle up a given slope q [deg], the following equation results:

If we include the equations for moving the Vehicle down a given slope q [deg], the following equation results:

The viscous damping term (mR M g cosq) contribution is so small that it can be effectively ignored and the following equation results.

If a disturbance force attributable to wind is to be introduced, the following equation results:

Finally, including the on-board Vehicle brakes exerting a braking force of FBRAKE [N] we have:

Vehicle Brake Model
The on-board Vehicle brake will not respond immediately due to the dynamics of the hydraulic system and other non-linear phenomena such as stiction, mechanical deadband/backlash, and static/dynamic friction. It is assumed that the on-board Vehicle brakes will reach steady state in approximately 1.25 [sec] and that the command force reference [N] has been scaled in such a way that the gain through the brake system from reference to applied force is unity.
For the sake of avoiding unnecessary complexity, the non-linear aspects of the braking system have been ignored and the following linear differential equation is used to describe the braking system:

Blower Fan Model
The normalized (as used in the simulation) blower fan model is given as:
Let:
|

|
= PPUX Per-normal motor inertia [sec] |
|

|
= PPUX per-normal blower (fan) inertia [sec] |
|

|
= PPUX Total per-normal inertia [sec]  |
|
PX |
= Pressure (X) [Pa] |
|

|
= PPUX per-normal Fan speed (1 => Max [rpm]) |
|

|
= PPUX per-normal motor torque (1 => Max [Nm]) |
|
ADuct |
= Cross sectional area of the Propulsion Duct [m^2] |
|
REFF(X) |
= PPUX effective fan radius [m] |
|

|
= PPUX motor maximum torque [Nm] |

This concludes the description of the physical first principal equations describing the dynamics of the physical plant.
CHAPTER 3
SIMULATION/CONTROL STRUCTURE
A description of the simulation follows. It includes a detailed description of the control strategy employed.
MAIN BLOCK DIAGRAM
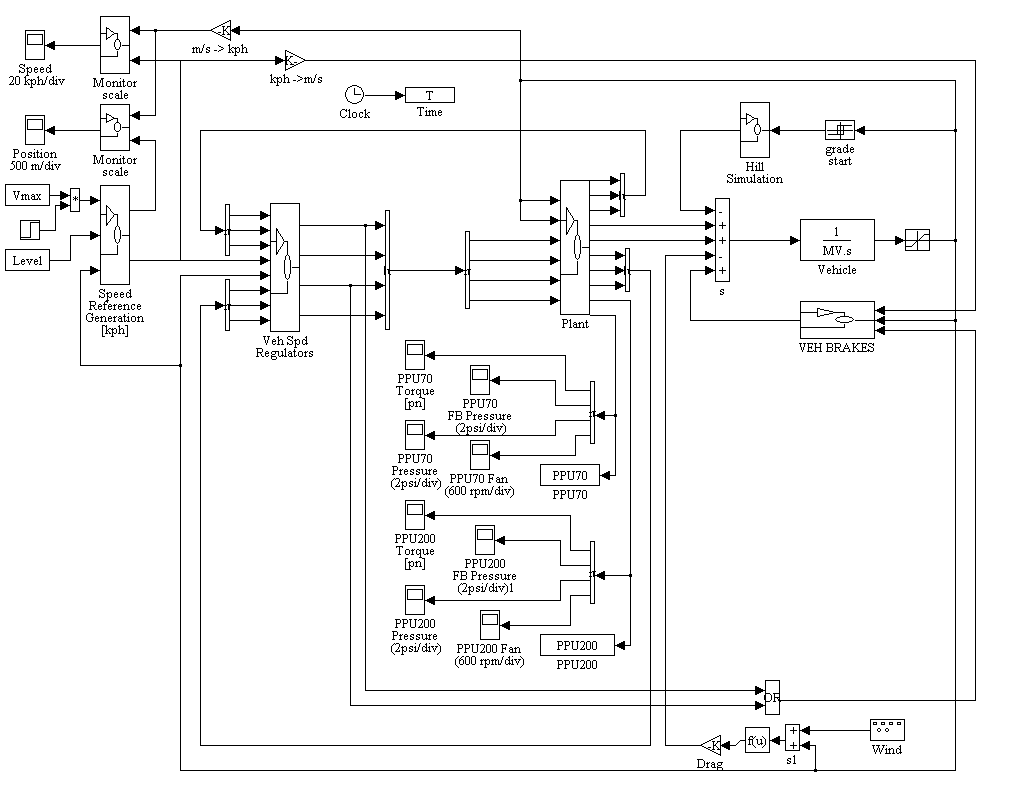
Figure 14. Main Block Diagram
PROPRIETARY
CHAPTER 4
SIMULATION RESULTS
SIMULATED SITE DESCRIPTION
The simulation was performed for a fixed run length of 1500 [m] for Vmax = 80 [kph], 1000 [m] for Vmax = 50 [kph], 600 [m] for Vmax = 30 [kph]. These lengths were chosen to ensure that the Vehicle reached the desired maximum speed for all simulated runs, including single PPU runs with maximum Vehicle+payload mass, and so that the runs completed in less than 125 [sec]. The run descriptions include set-up parameters employed during the simulated run. For controler parameters used during the simulation, see Appendix C. This Appendix is a listing of the script file that was used to initialize the simulation.
The runs are from station 1 to station 2, and station 2 to station 1, with empty (12300 [kg]), mid-load (21300 [kg]), and full (30300 [kg]) Vehicle payloads. The first two runs were performed without the Vehicle on-board brake system engaged, all subsequent runs were performed with the on-board Vehicle braking system activated.
Empty Load (Single PPU) (Vmax = 80 [kph])
Station 1 to Station 2 (PPU 200 pushing), empty Vehicle, Flat grade. (no Brakes)
Grade = 0
No Brakes
Single PPU
PPU200 -> PPU70
MV = 12300 [Kg]
Vmax = 80 [kph]
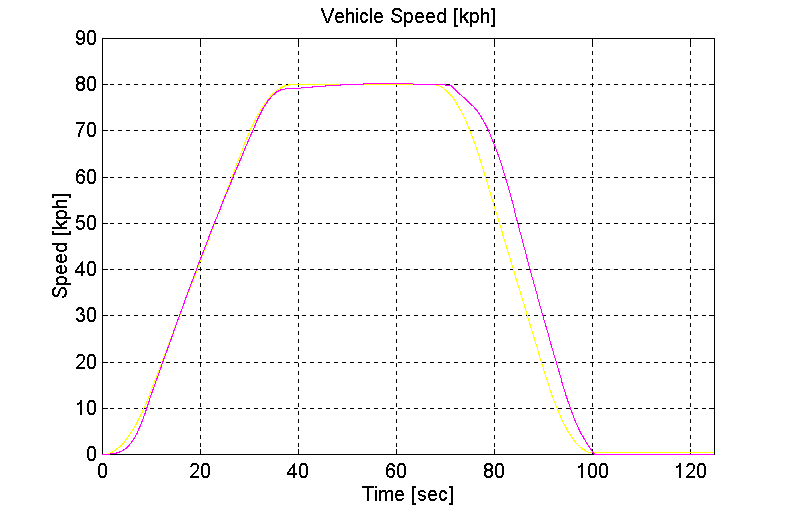
Figure 39. Vehicle Speed, One PPU, Station 1 to 2, Empty Vehicle (no brakes)
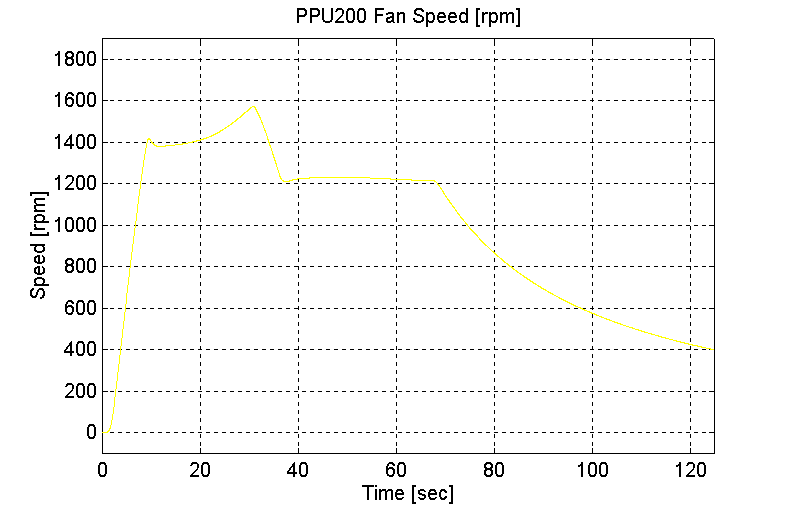
Figure 40. PPU200 Blower Speed, One PPU, Station 1 to 2, Empty Vehicle (no brakes)
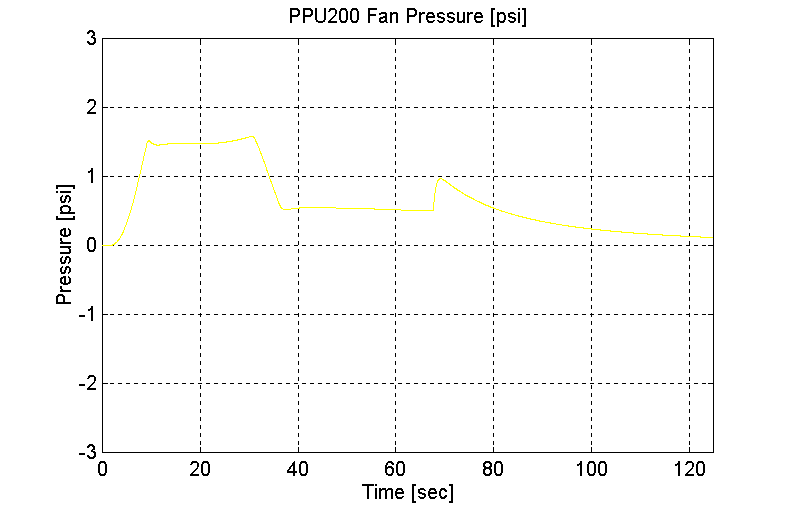
Figure 41. PPU200 Fan Pressure, One PPU, Station 1 to 2, Empty Vehicle (no brakes)
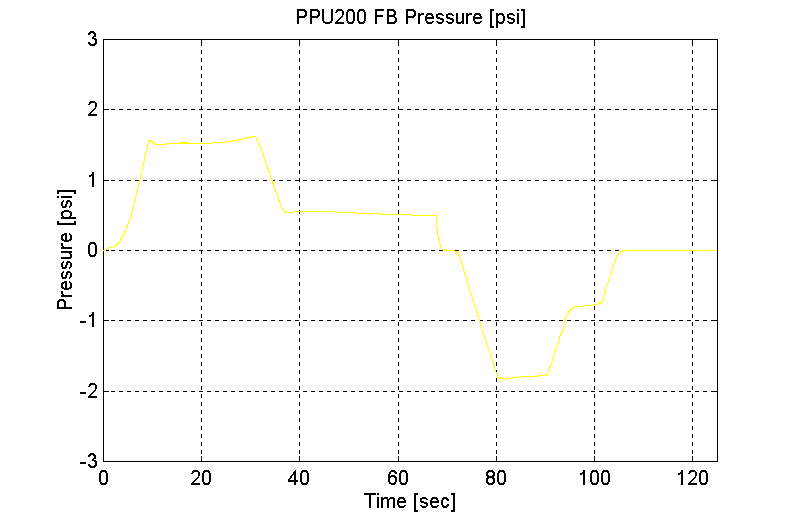
Figure 42. PPU200 FB Pressure, One PPU, Station 1 to 2, Empty Vehicle (no brakes)
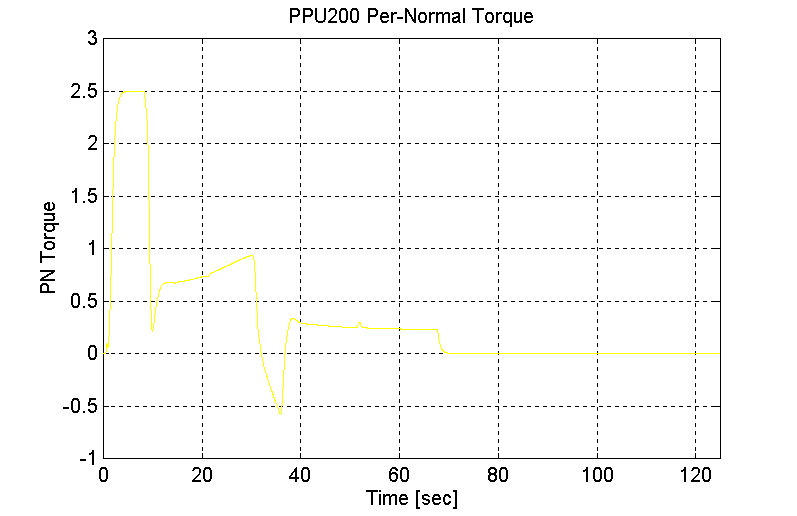
Figure 43. PPU200 PN Torque, One PPU, Station 1 to 2, Empty Vehicle (no brakes)
Station 2 to Station 1 (PPU 200 pulling), empty Vehicle, Flat grade. (no Brakes)
Grade = 0
No Brakes
Single PPU
PPU70 -> PPU200
MV = 12300 [Kg]
Vmax = = 80 [kph]
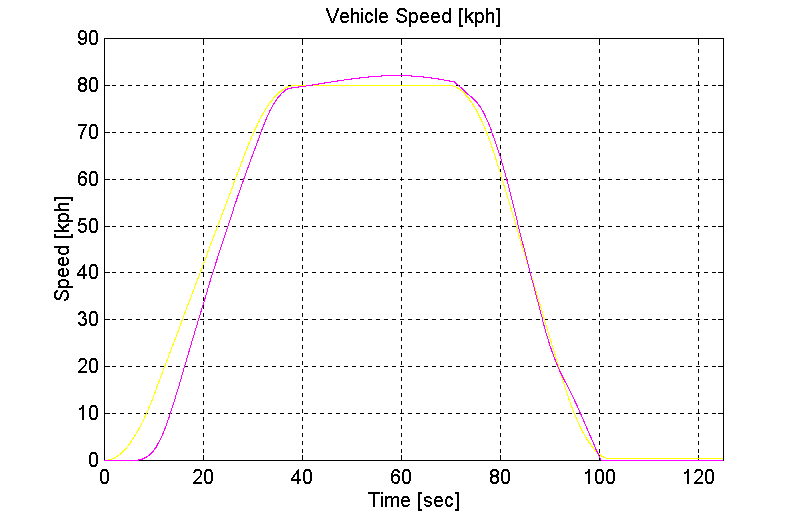
Figure 44. Vehicle Speed, One PPU, Station 2 to 1, Empty Vehicle (no brakes)
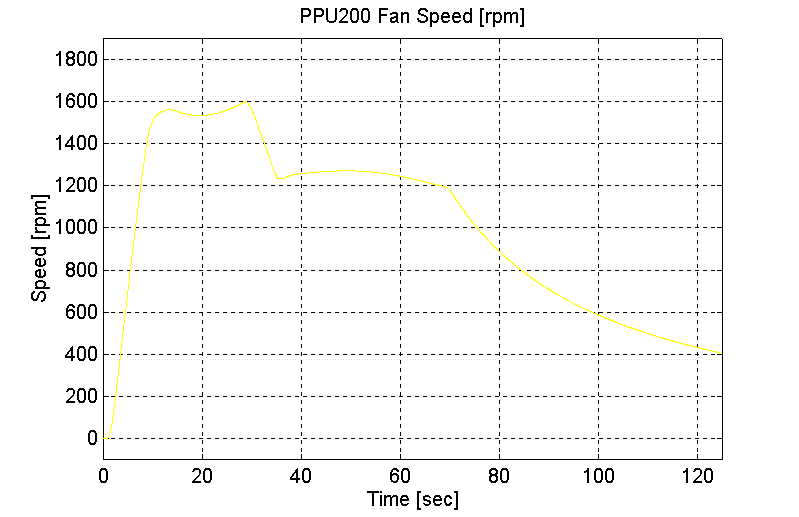
Figure 45. PPU200 Blower Speed, One PPU, Station 2 to 1, Empty Vehicle (no brakes)
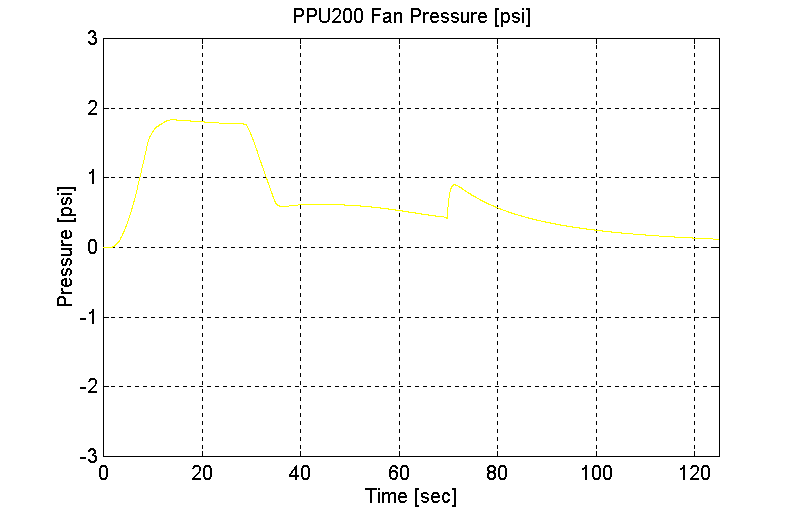
Figure 46. PPU200 Fan Pressure, One PPU, Station 2 to 1, Empty Vehicle (no brakes)

Figure 47. PPU200 FB Pressure, One PPU, Station 2 to 1, Empty Vehicle (no brakes)
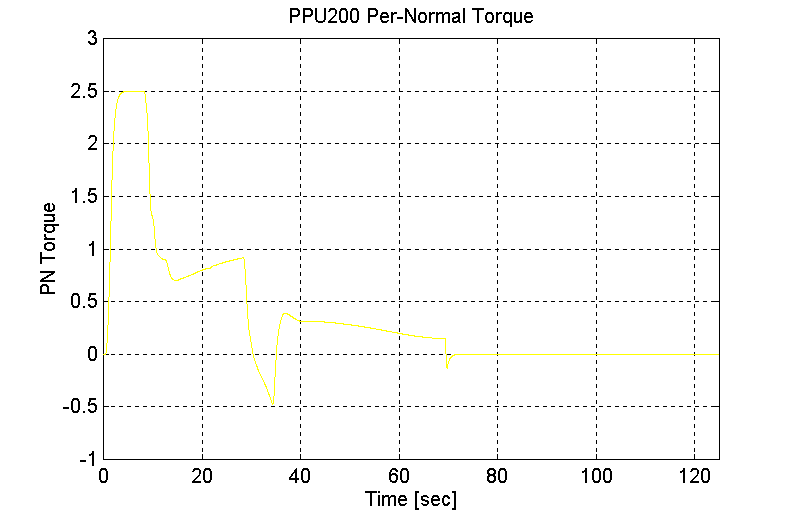
Figure 48. PPU200 Per-Normal Torque, One PPU, Station 2 to 1, Empty Vehicle (no brakes)
Station 1 to Station 2 (PPU 200 pushing), empty Vehicle, Flat grade.
Grade = 0
With Brakes
Single PPU
PPU200 -> PPU70
MV = 12300 [Kg]
Vmax = = 80 [kph]
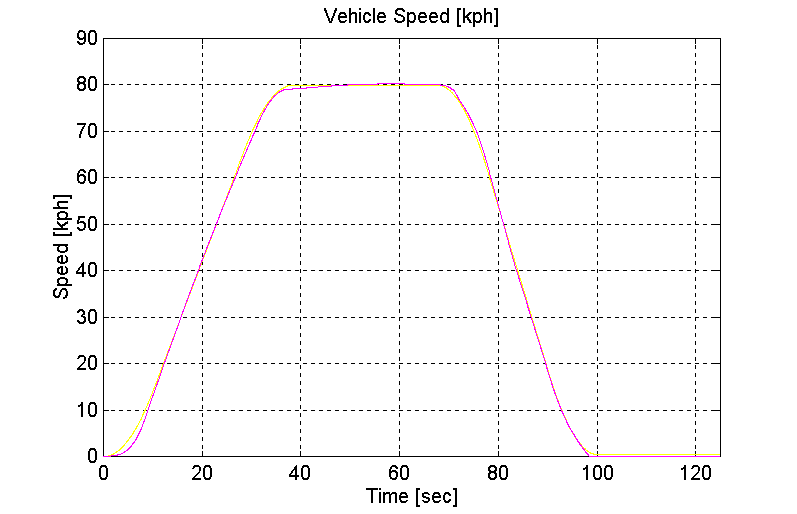
Figure 49. Vehicle Speed, One PPU, Station 1 to 2, Empty Vehicle
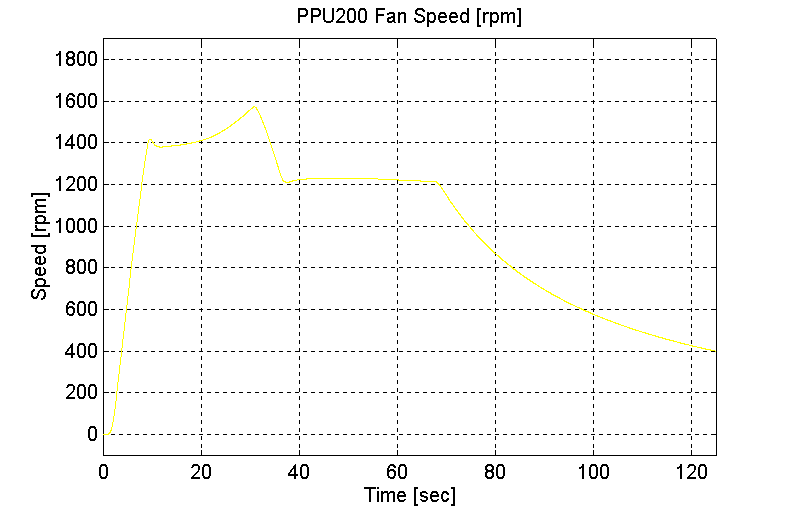
Figure 50. PPU200 Fan Speed, One PPU, Station 1 to 2, Empty Vehicle
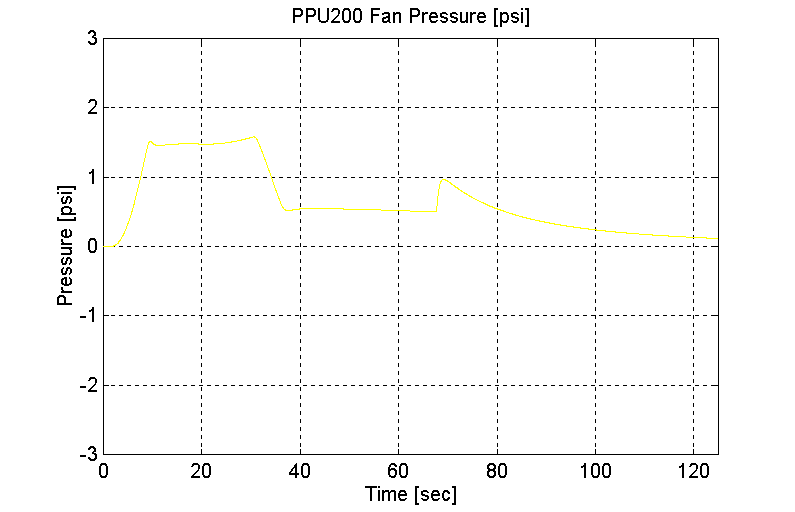
Figure 51. PPU200 Fan Pressure, One PPU, Station 1 to 2, Empty Vehicle
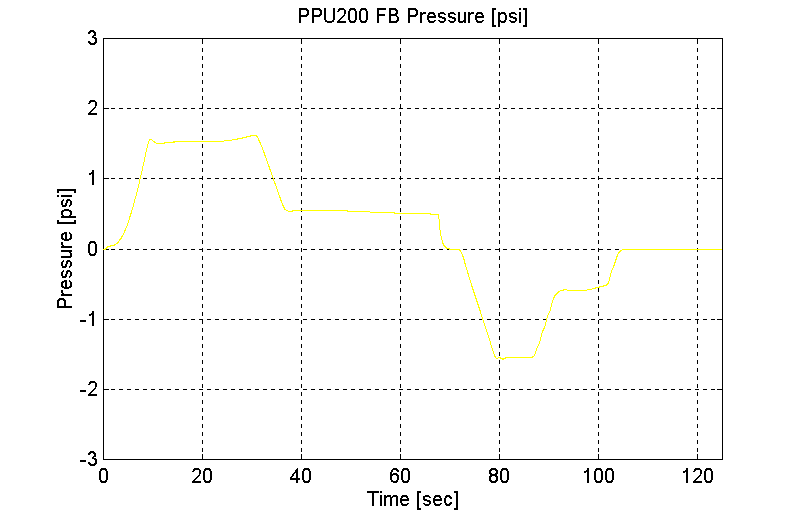
Figure 52. PPU200 FB Pressure, One PPU, Station 1 to 2, Empty Vehicle
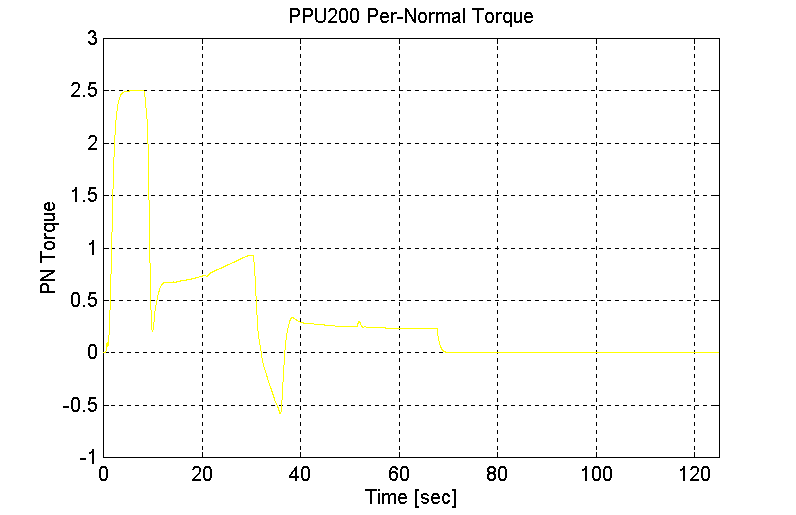
Figure 53. PPU200 Per-Normal Torque, One PPU, Station 1 to 2, Empty Vehicle
Station 2 to Station 1 (PPU 200 pulling), empty Vehicle, Flat grade.
Grade = 0
With Brakes
Single PPU
PPU70 -> PPU200
MV = 12300 [Kg]
Vmax = 80 [kph]
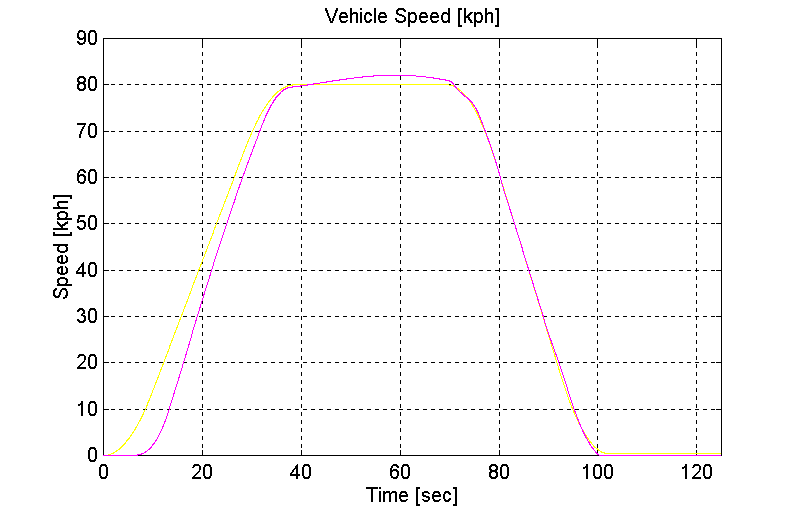
Figure 54. Vehicle Speed, One PPU, Station 2 to 1, Empty Vehicle
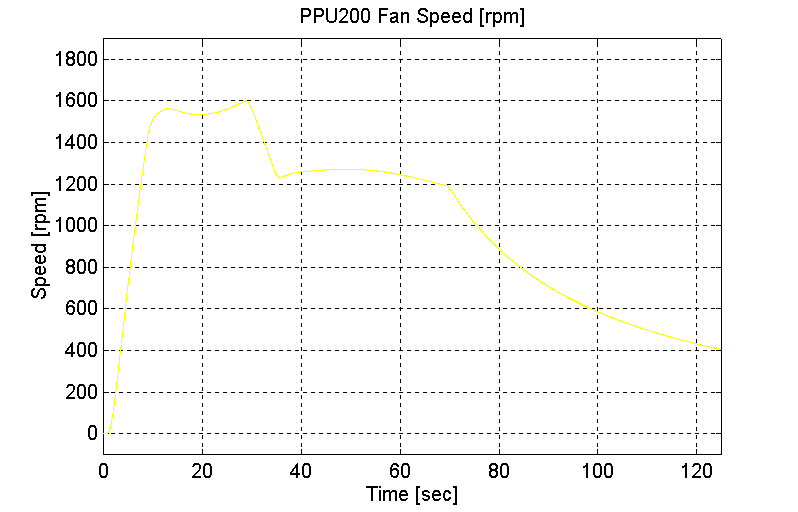
Figure 55. PPU200 Fan Speed, One PPU, Station 2 to 1, Empty Vehicle
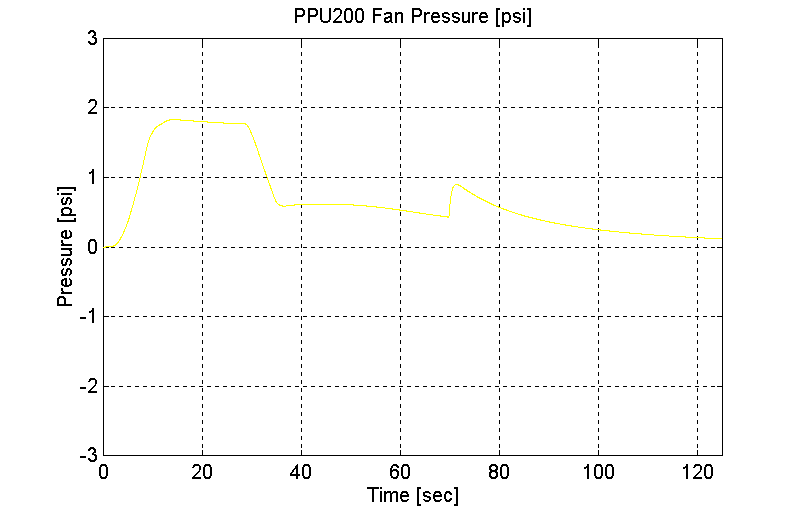
Figure 56. PPU200 Fan Pressure, One PPU, Station 2 to 1, Empty Vehicle
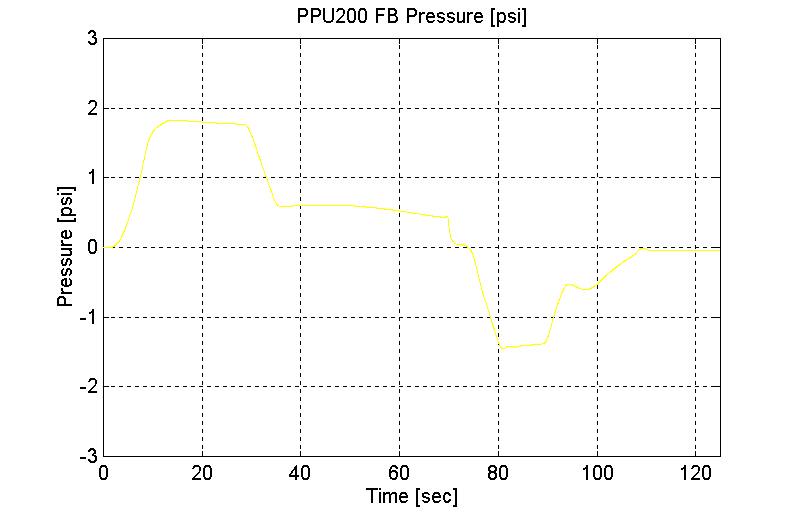
Figure 57. PPU200 FB Pressure, One PPU, Station 2 to 1, Empty Vehicle
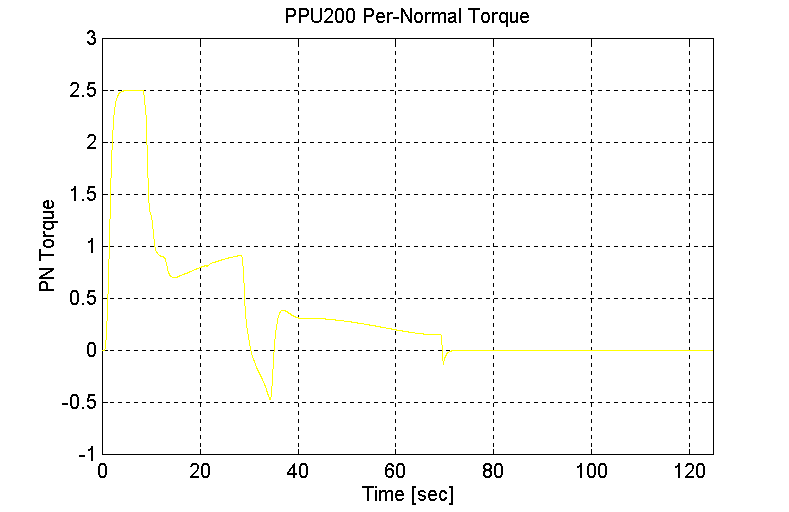
Figure 58. PPU200 Per-Normal Torque, One PPU, Station 2 to 1, Empty Vehicle
Average Load (Single PPU) (Vmax = 80 [kph])
Station 1 to Station 2 (PPU 200 pushing), mid-load Vehicle, Flat grade
Grade = 0
With Brakes
Single PPU
PPU200 -> PPU70
MV = 21300 [Kg]
Vmax = = 80 [kph]
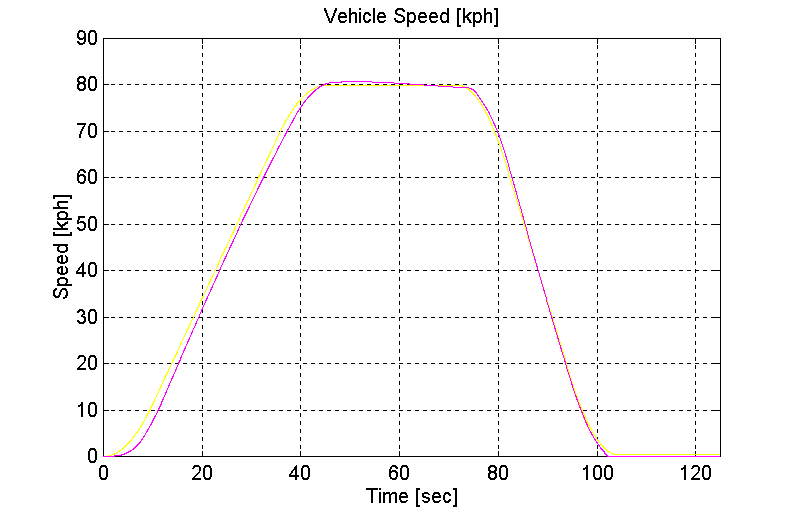
Figure 59. Vehicle Speed, One PPU, Station 1 to 2, Mid-Load Vehicle
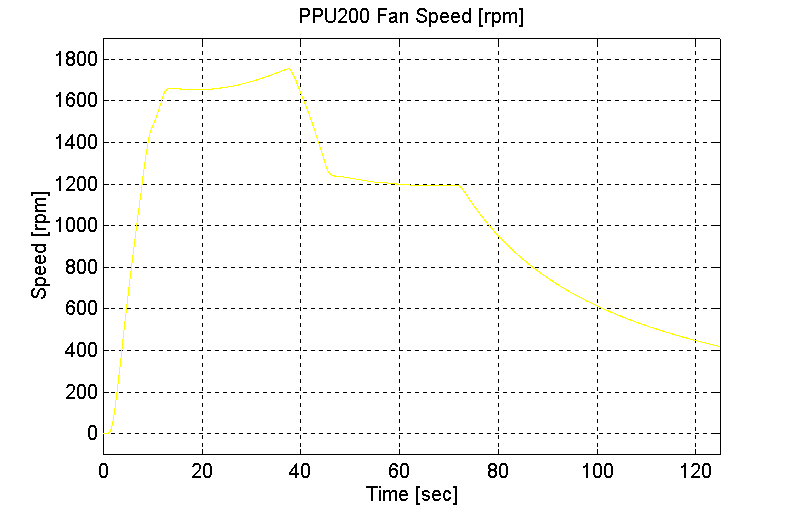
Figure 60. PPU200 Fan Speed, One PPU, Station 1 to 2, Mid-Load Vehicle
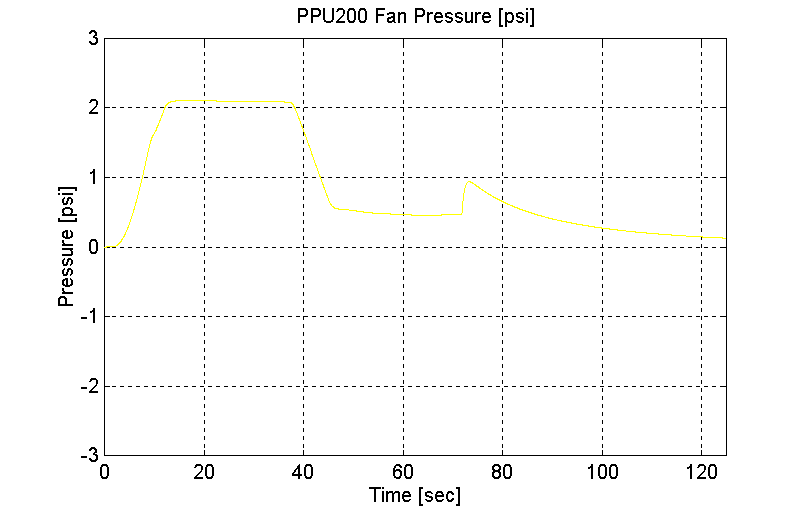
Figure 61. PPU200 Fan Pressure, One PPU, Station 1 to 2, Mid-Load Vehicle

Figure 62. PPU200 FB Pressure, One PPU, Station 1 to 2, Mid-Load Vehicle
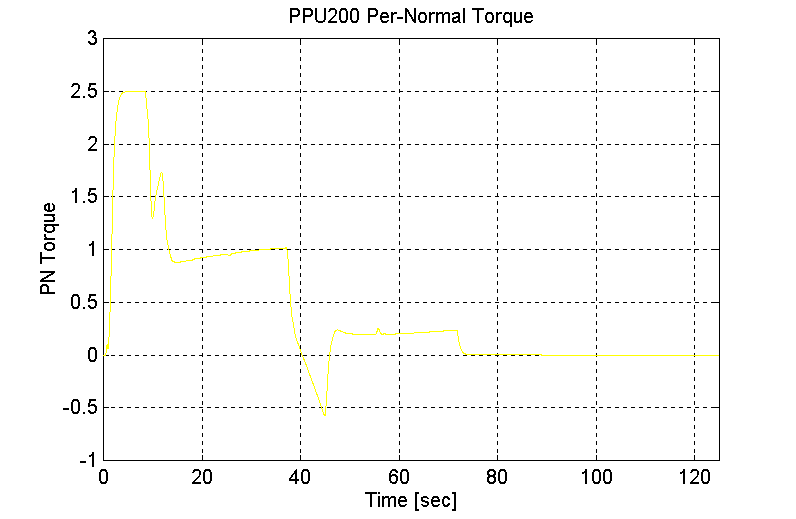
Figure 63. PPU200 Per-Normal Torque, One PPU, Station 1 to 2, Mid-Load Vehicle
Station 2 to Station 1 (PPU 200 pulling), mid-load Vehicle, Flat grade
Grade = 0
With Brakes
Single PPU
PPU70 -> PPU200
MV = 21300 [Kg]
Vmax = = 80 [kph]
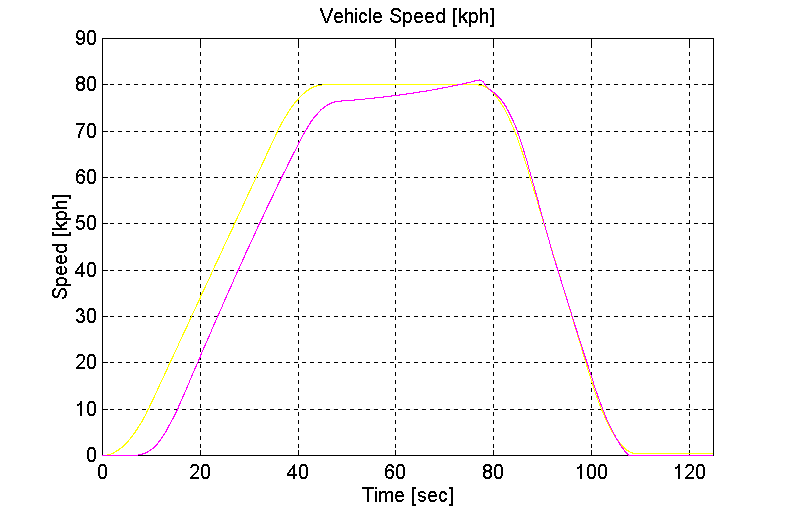
Figure 64. Vehicle Speed, One PPU, Station 2 to 1, Mid-Load Vehicle
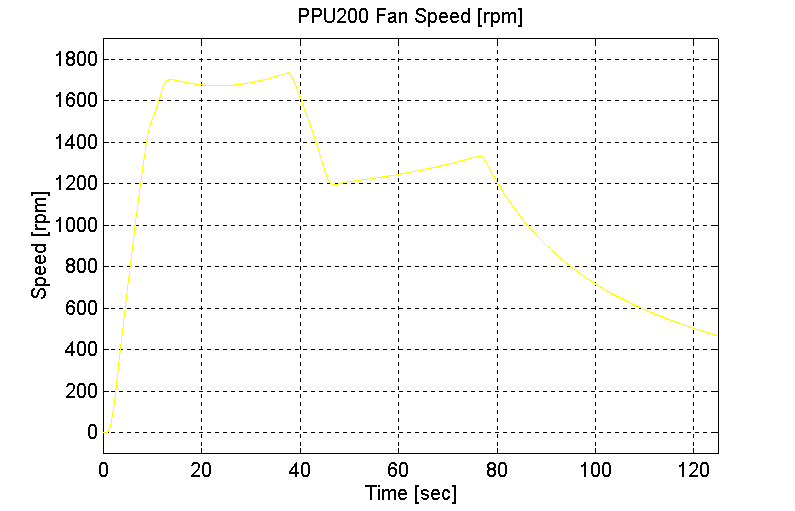
Figure 65. PPU200 Fan Speed, One PPU, Station 2 to 1, Mid-Load Vehicle
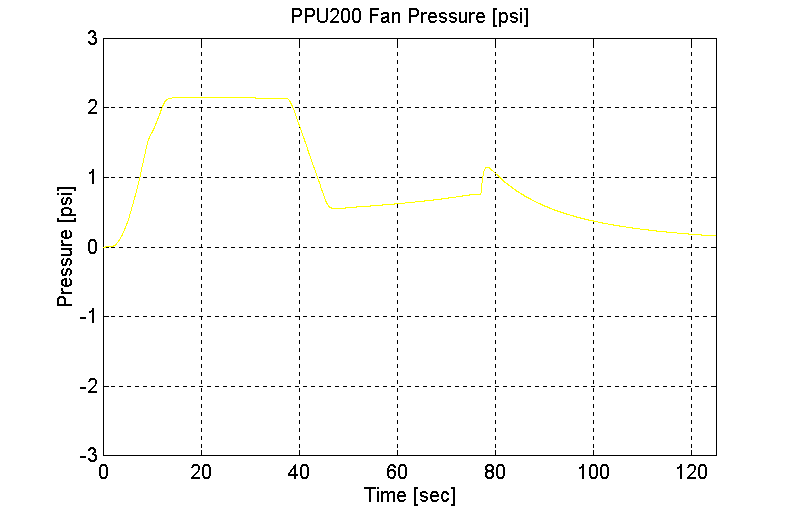
Figure 66. PPU200 Fan Pressure, One PPU, Station 2 to 1, Mid-Load Vehicle
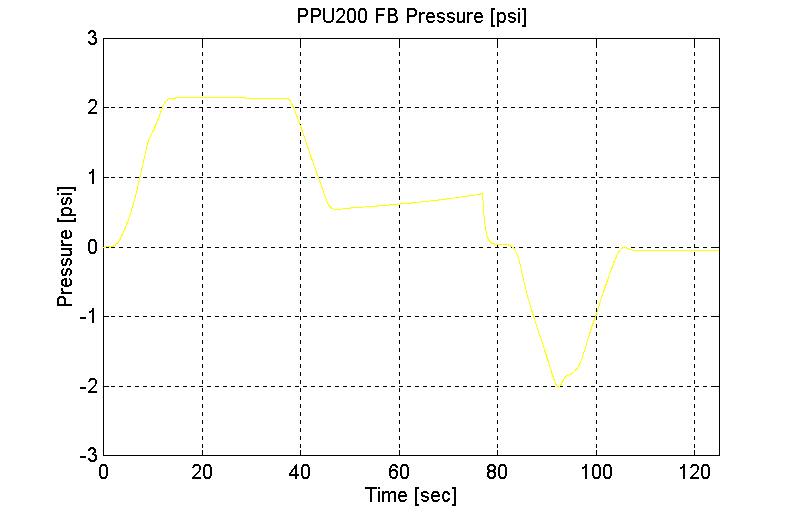
Figure 67. PPU200 FB Pressure, One PPU, Station 2 to 1, Mid-Load Vehicle
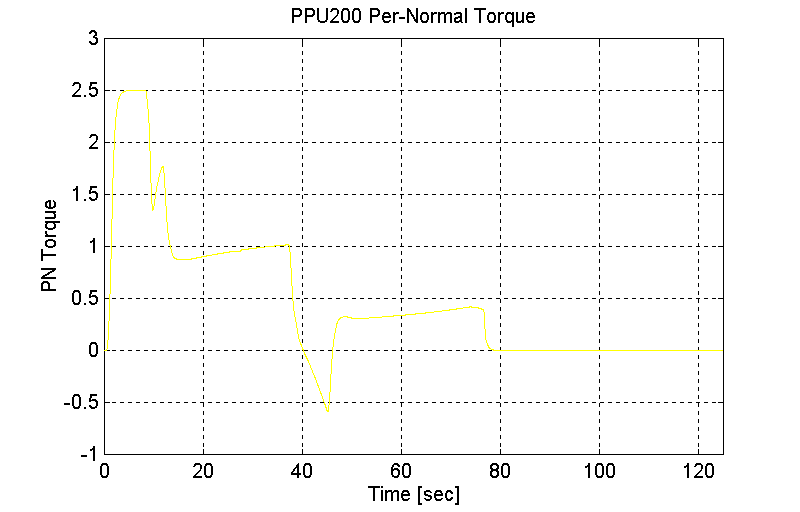
Figure 68. PPU200 Per-Normal Torque, One PPU, Station 2 to 1, Mid-Load Vehicle
Full Load (Single PPU) (Vmax = 80 [kph])
Station 1 to Station 2 (PPU 200 pushing), full Vehicle, Flat grade.
Grade = 0
With Brakes
Single PPU
PPU200 -> PPU70
MV = 30300 [Kg]
Vmax = = 80 [kph]
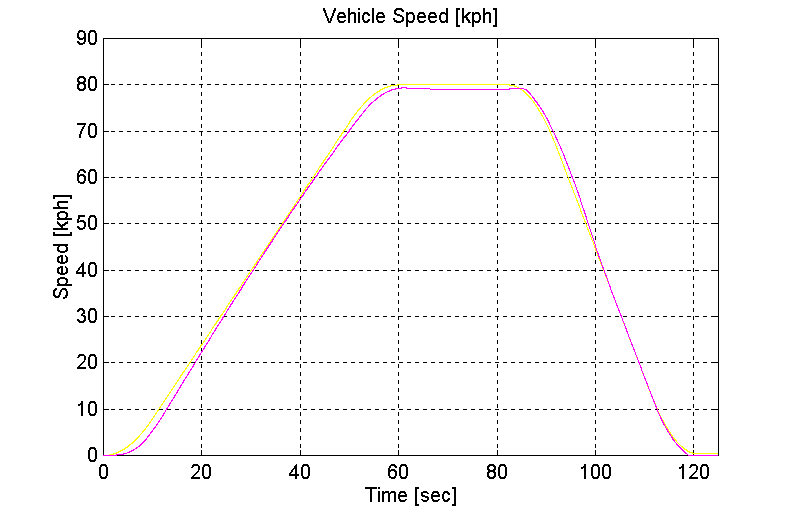
Figure 69. Vehicle Speed, One PPU, Station 1 to 2, Full-Load Vehicle
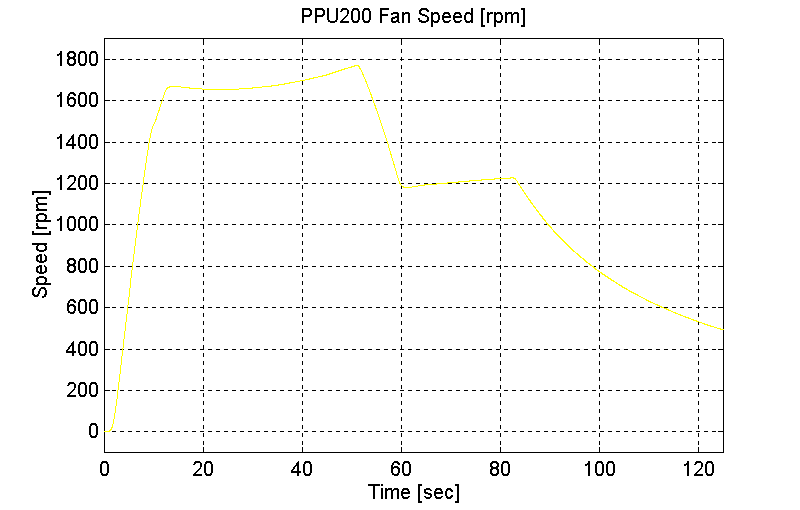
Figure 70. PPU200 Fan Speed, One PPU, Station 1 to 2, Full-Load Vehicle
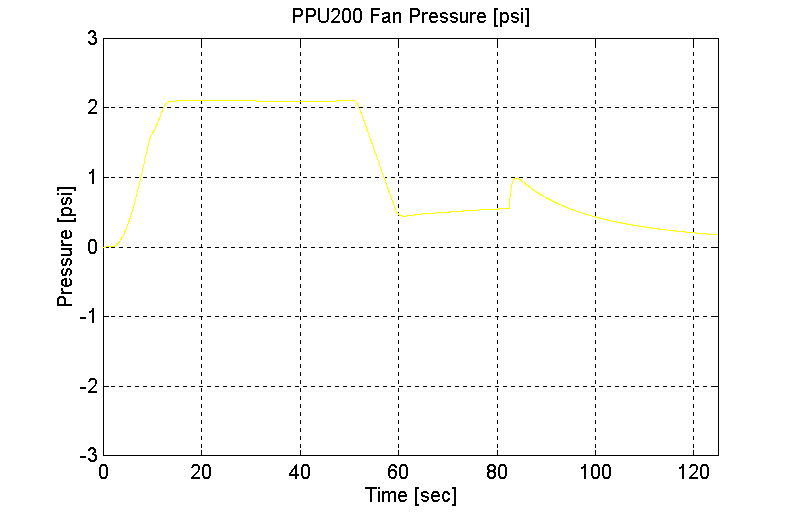
Figure 71. PPU200 Fan Pressure, One PPU, Station 1 to 2, Full-Load Vehicle
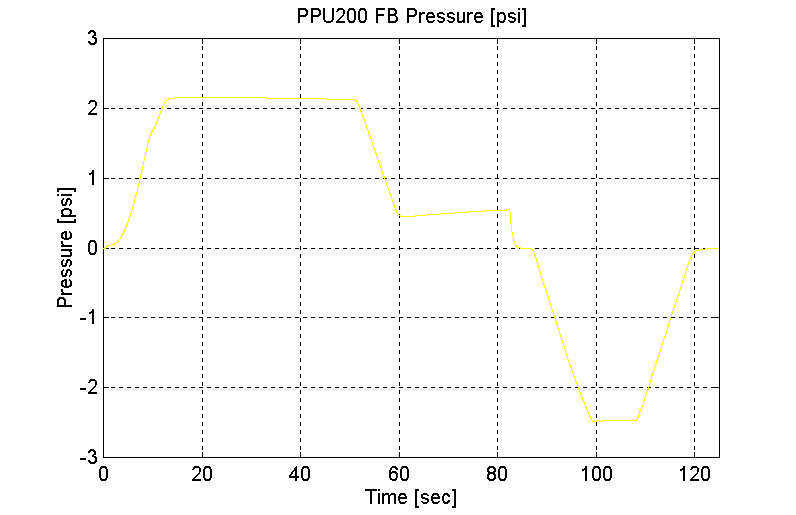
Figure 72. PPU200 FB Pressure, One PPU, Station 1 to 2, Full-Load Vehicle
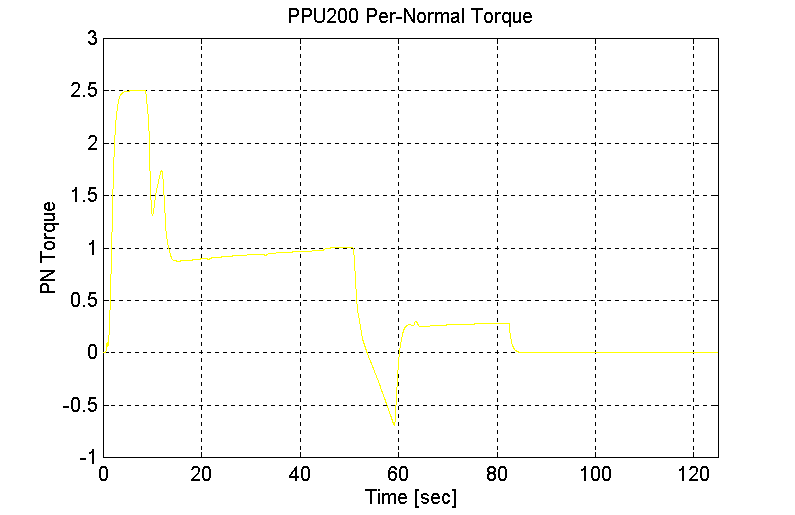
Figure 73. PPU200 Per-Normal Torque, One PPU, Station 1 to 2, Full-Load Vehicle
Station 2 to Station 1 (PPU 200 pulling), full Vehicle, Flat grade.
Grade = 0
With Brakes
Single PPU
PPU70 -> PPU200
MV = 30300 [Kg]
Vmax = = 80 [kph]
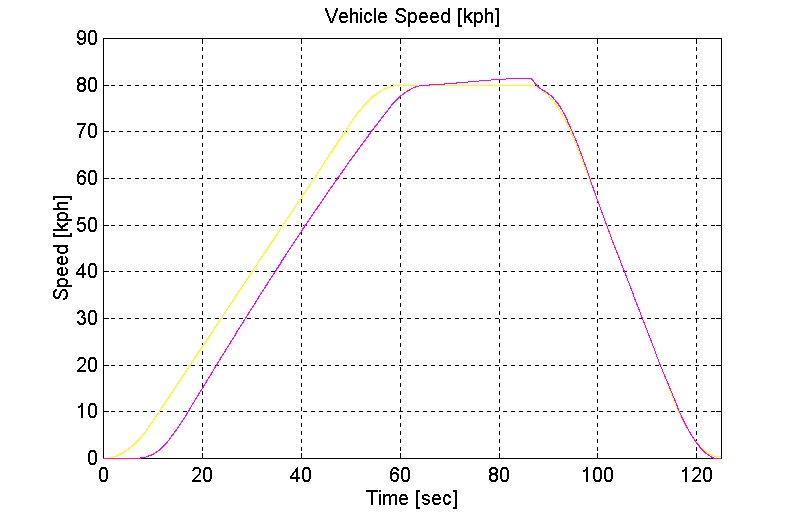
Figure 74. Vehicle Speed, One PPU, Station 2 to 1, Full-Load Vehicle

Figure 75. PPU200 Fan Speed, One PPU, Station 2 to 1, Full-Load Vehicle
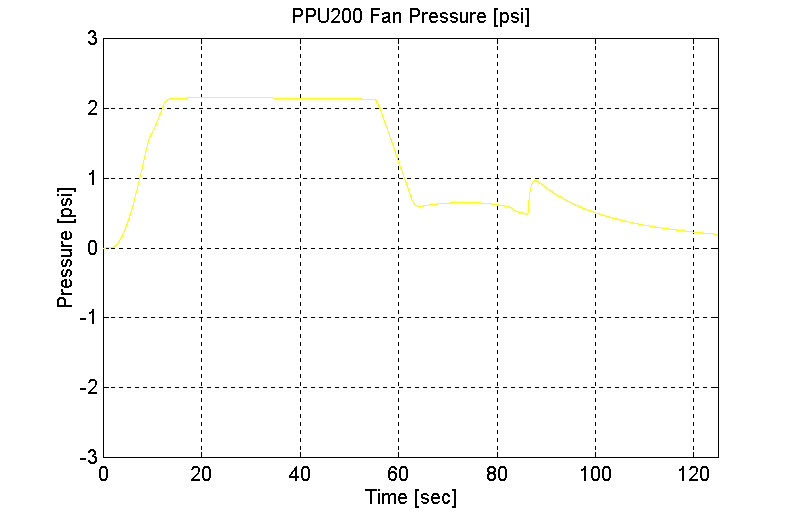
Figure 76. PPU200 Fan Pressure, One PPU, Station 2 to 1, Full-Load Vehicle
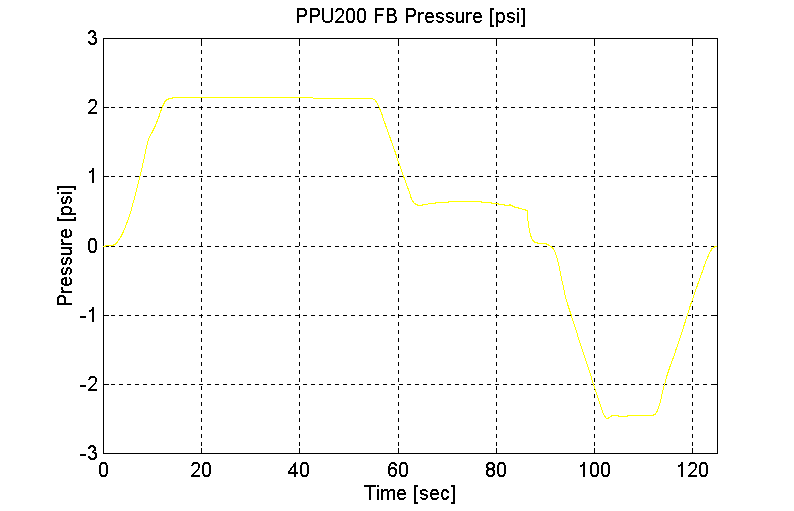
Figure 77. PPU200 FB Pressure, One PPU, Station 2 to 1, Full-Load Vehicle
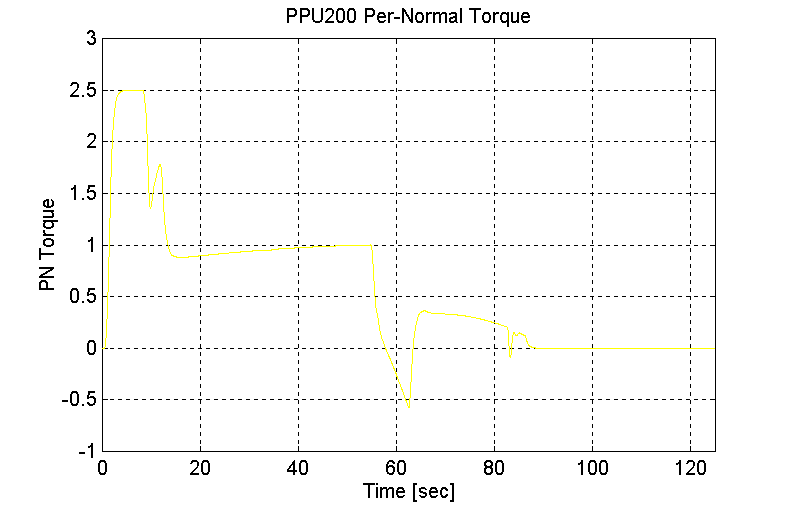
Figure 78. PPU200 Per-Normal Torque, One PPU, Station 2 to 1, Full-Load Vehicle
Empty Load (Dual PPU’s) (Vmax = 80 [kph])
Station 1 to Station 2 (PPU 200 pushing, PPU70 pulling), empty Vehicle, Flat grade.
Grade = 0
No Brakes
Twin PPU’s
PPU200 -> PPU70
MV = 12300 [Kg]
Vmax = = 80 [kph]
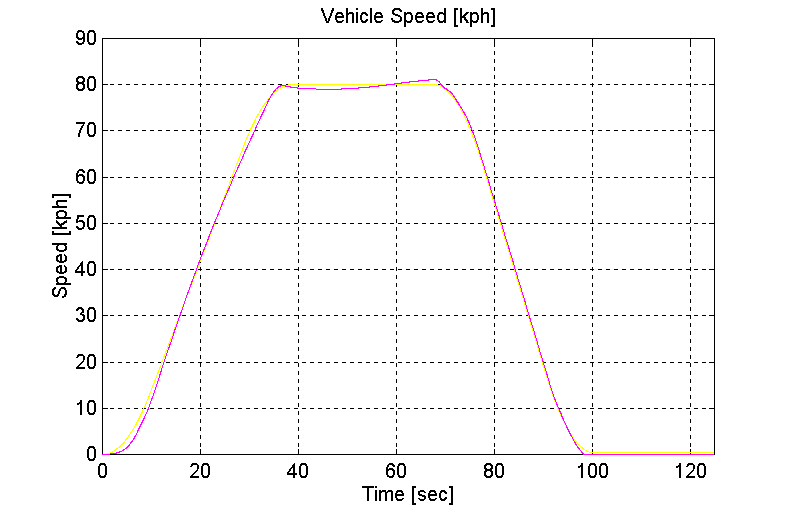
Figure 79. Vehicle Speed, Dual PPU’s, Station 1 to 2, Empty Vehicle
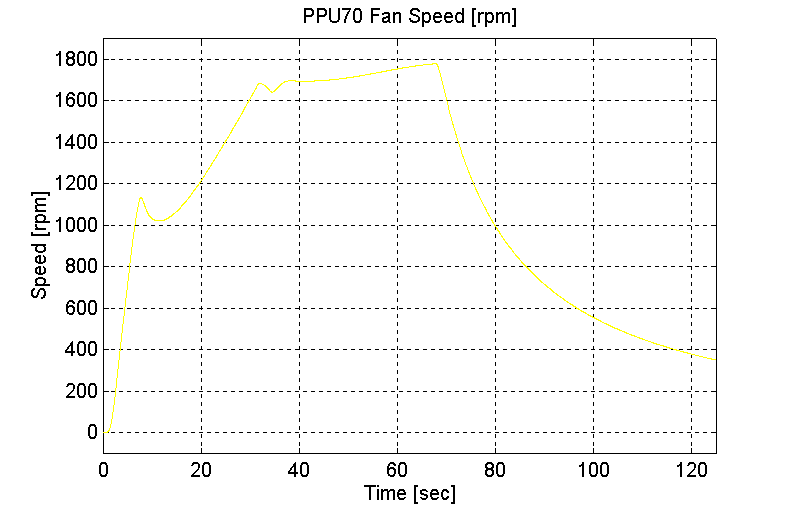
Figure 80. PPU70 Fan Speed, Dual PPU’s, Station 1 to 2, Empty Vehicle
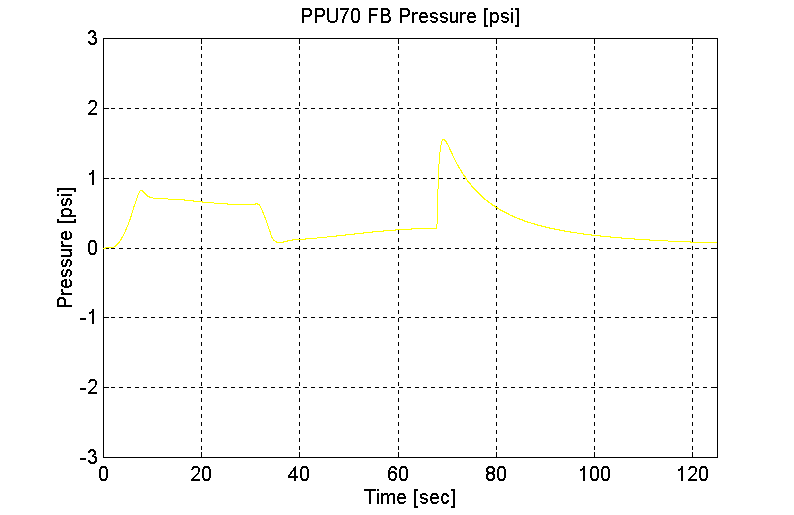
Figure 81. PPU70 Fan Pressure, Dual PPU’s, Station 1 to 2, Empty Vehicle
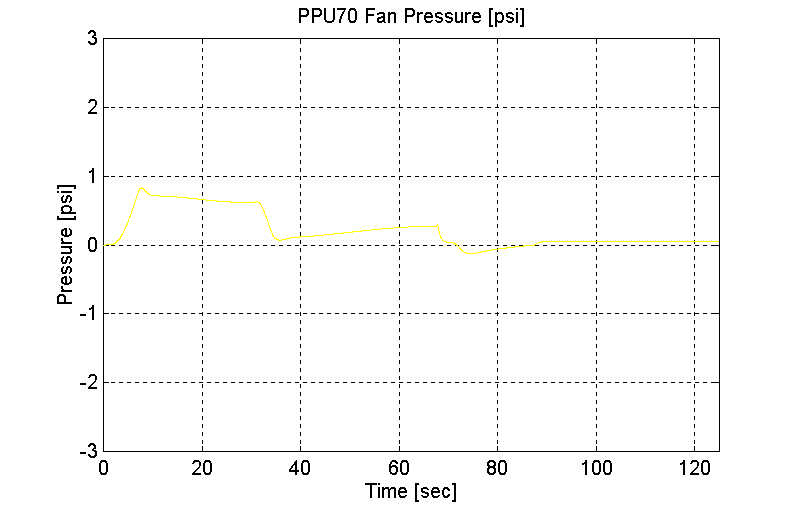
Figure 82. PPU70 FB Pressure, Dual PPU’s, Station 1 to 2, Empty Vehicle
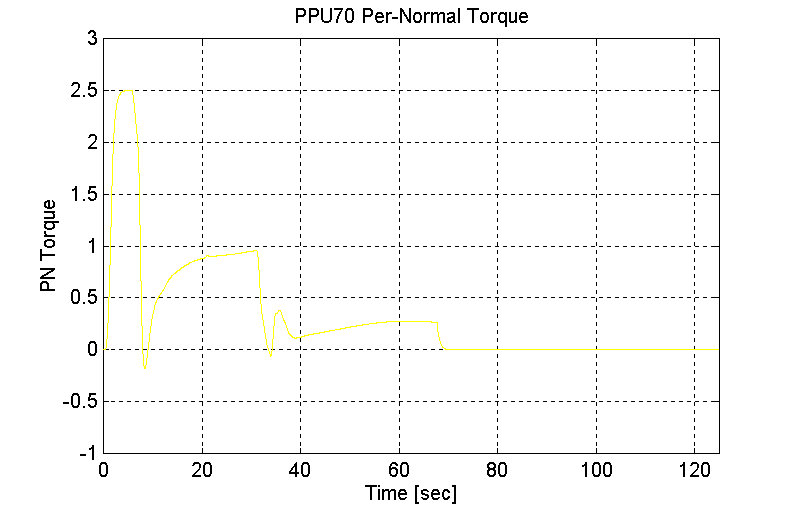
Figure 83. PPU70 Per-Normal Torque, Dual PPU’s, Station 1 to 2, Empty Vehicle
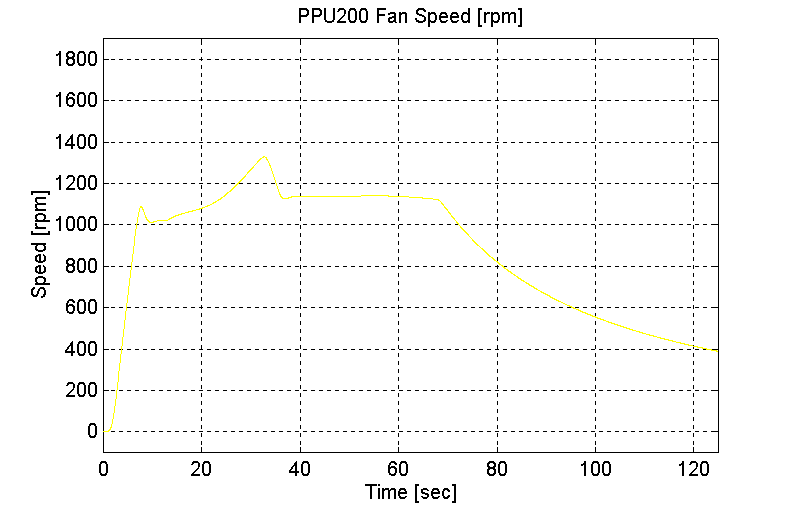
Figure 84. PPU200 Fan Speed, Dual PPU’s, Station 1 to 2, Empty Vehicle
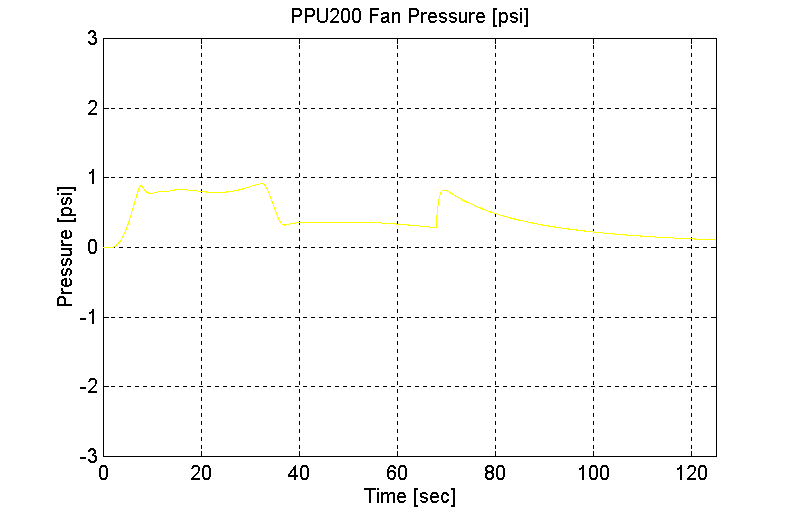
Figure 85. PPU200 Fan Pressure, Dual PPU’s, Station 1 to 2, Empty Vehicle
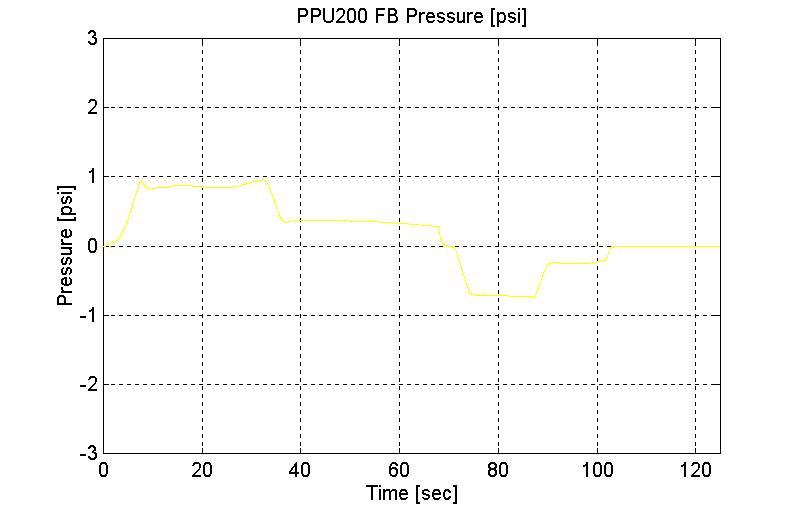
Figure 86. PPU200 FB Pressure, Dual PPU’s, Station 1 to 2, Empty Vehicle
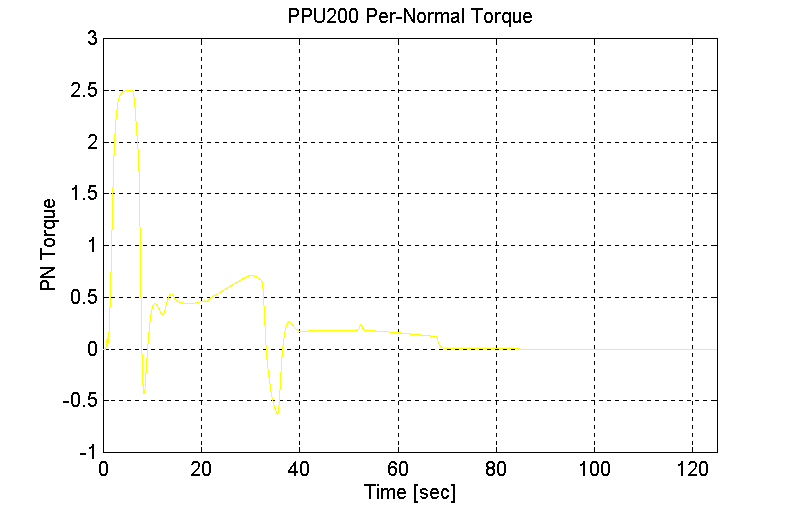
Figure 87. PPU200 Per-Normal Torque, Dual PPU’s, Station 1 to 2, Empty Vehicle
Station 2 to Station 1 (PPU 200 pulling, PPU70 pushing), empty Vehicle, Flat grade.
Grade = 0
No Brakes
Twin PPU’s
PPU70 -> PPU200
MV = 12300 [Kg]
Vmax = = 80 [kph]
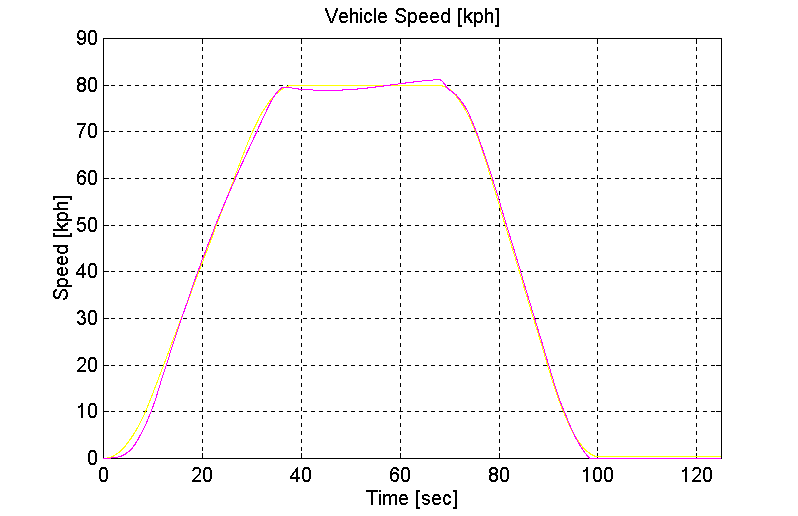
Figure 88. Vehicle Speed, Dual PPU’s, Station 2 to 1, Empty Vehicle
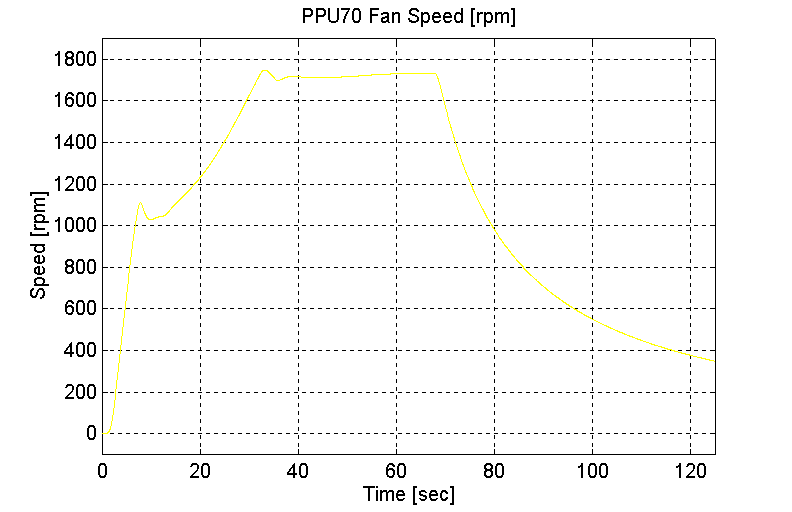
Figure 89. PPU70 Fan Speed, Dual PPU’s, Station 2 to 1, Empty Vehicle

Figure 90. PPU70 Fan Pressure, Dual PPU’s, Station 2 to 1, Empty Vehicle
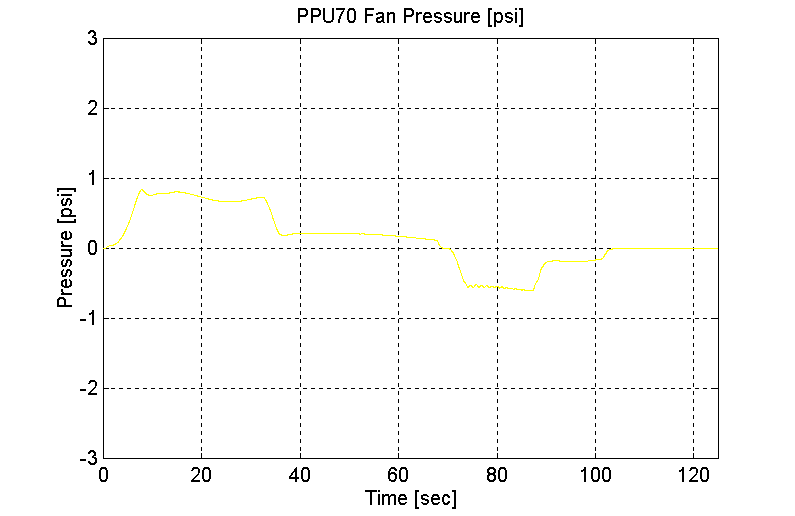
Figure 91. PPU70 FB Pressure, Dual PPU’s, Station 2 to 1, Empty Vehicle
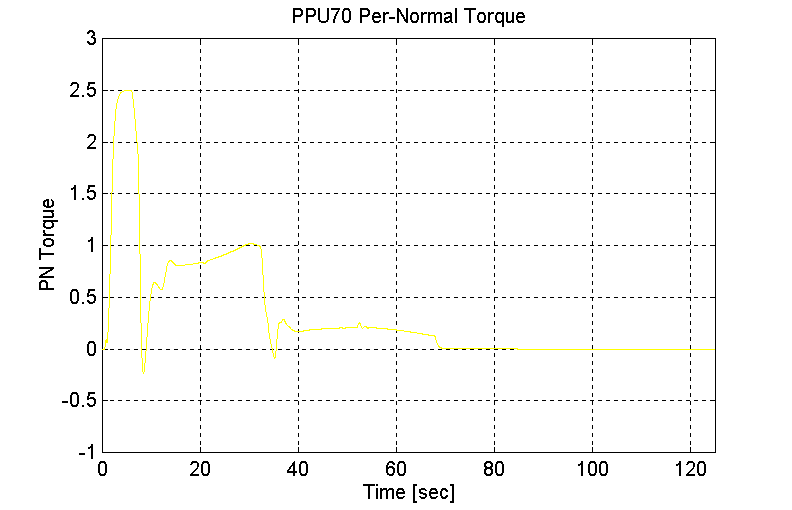
Figure 92. PPU70 Per-Normal Torque, Dual PPU’s, Station 2 to 1, Empty Vehicle
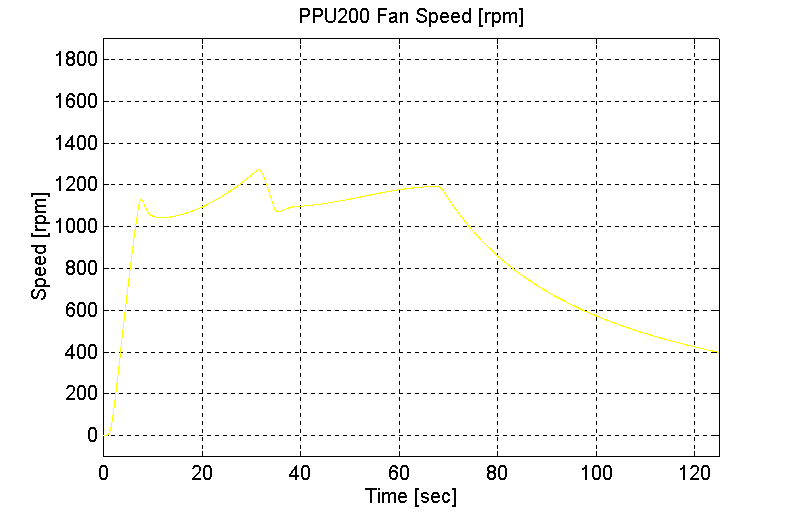
Figure 93. PPU200 Fan Speed, Dual PPU’s, Station 2 to 1, Empty Vehicle
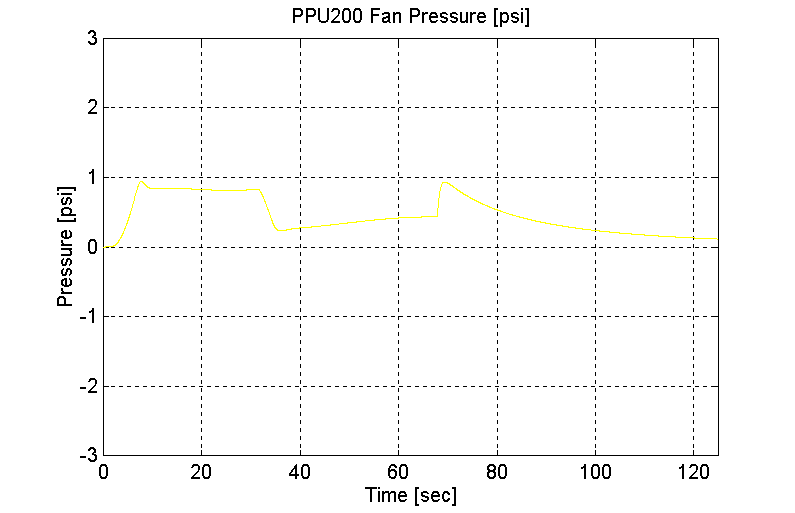
Figure 94. PPU200 Fan Pressure, Dual PPU’s, Station 2 to 1, Empty Vehicle
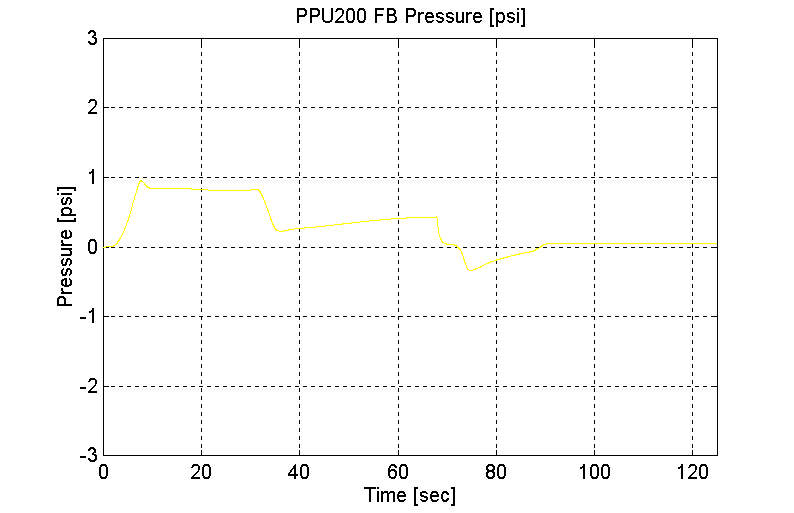
Figure 95. PPU200 FB Pressure, Dual PPU’s, Station 2 to 1, Empty Vehicle
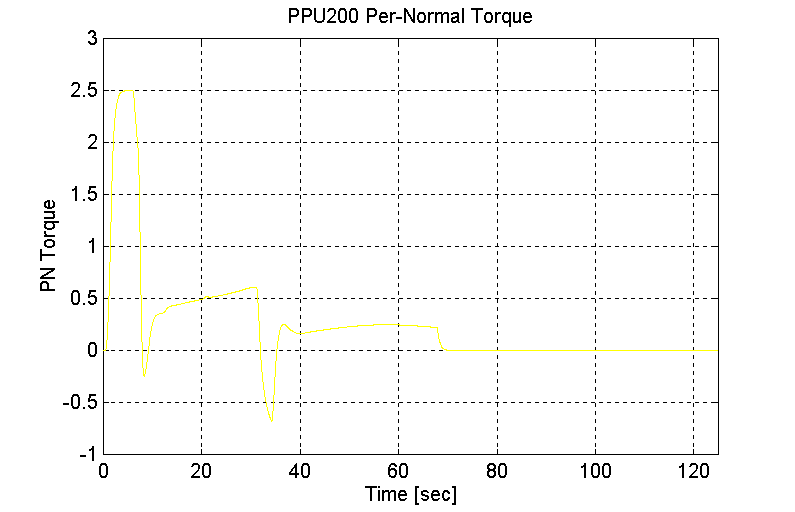
Figure 96. PPU200 Per-Normal Torque, Dual PPU’s, Station 2 to 1, Empty Vehicle
Average Load (Dual PPU’s) (Vmax = 80 [kph])
Station 1 to Station 2 (PPU 200 pushing, PPU70 pulling), mid-load Vehicle, Flat grade
Grade = 0
With Brakes
Dual PPU’s
PPU200 -> PPU70
MV = 21300 [Kg]
Vmax = = 80 [kph]
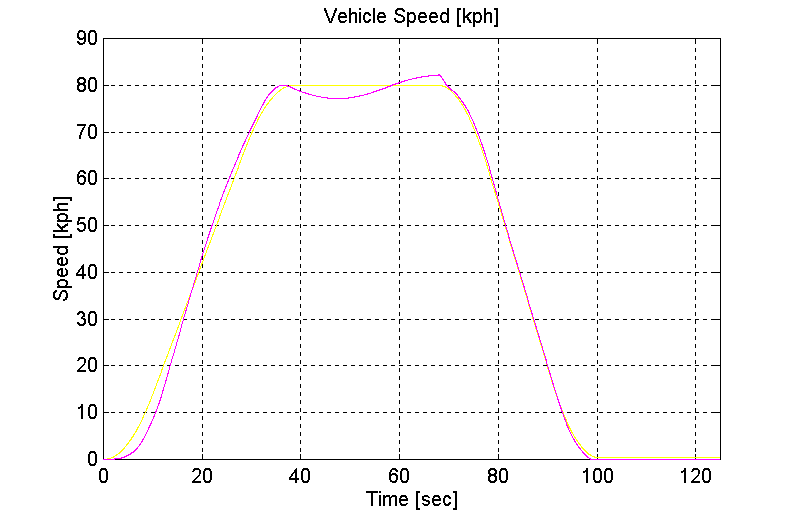
Figure 97. Vehicle Speed, Dual PPU’s, Station 1 to 2, Mid-Load Vehicle
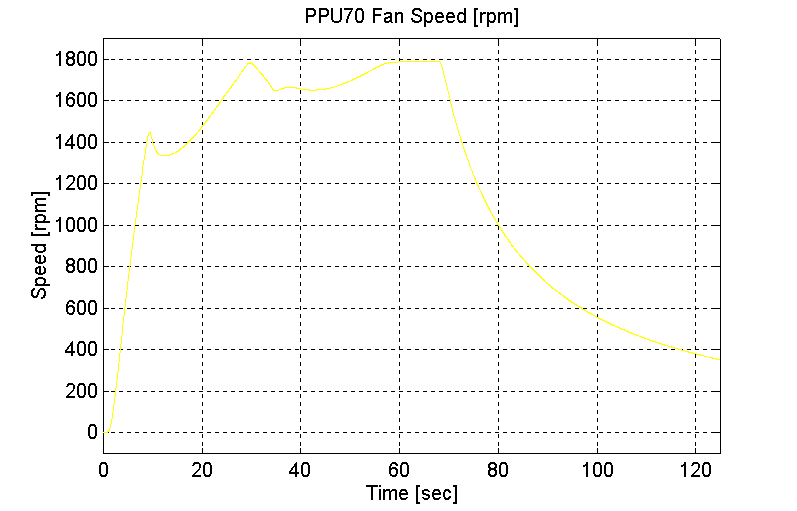
Figure 98. PPU70 Fan Speed, Dual PPU’s, Station 1 to 2, Mid-Load Vehicle
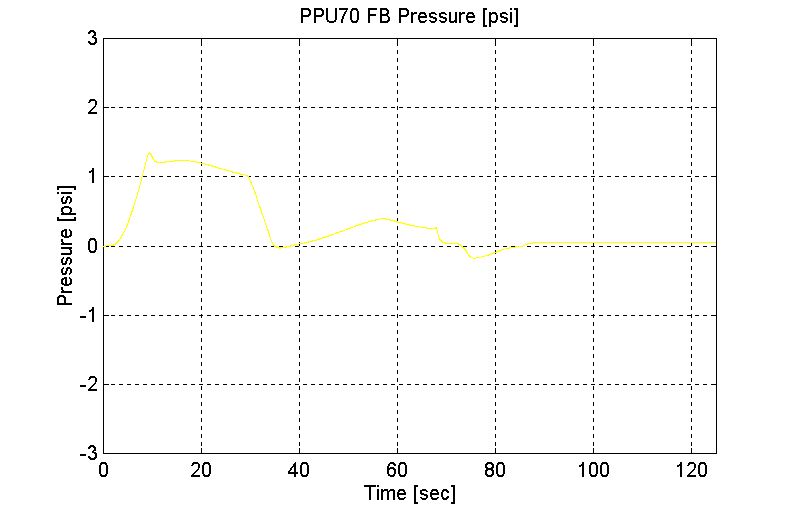
Figure 99. PPU70 FB Pressure, Dual PPU’s, Station 1 to 2, Mid-Load Vehicle
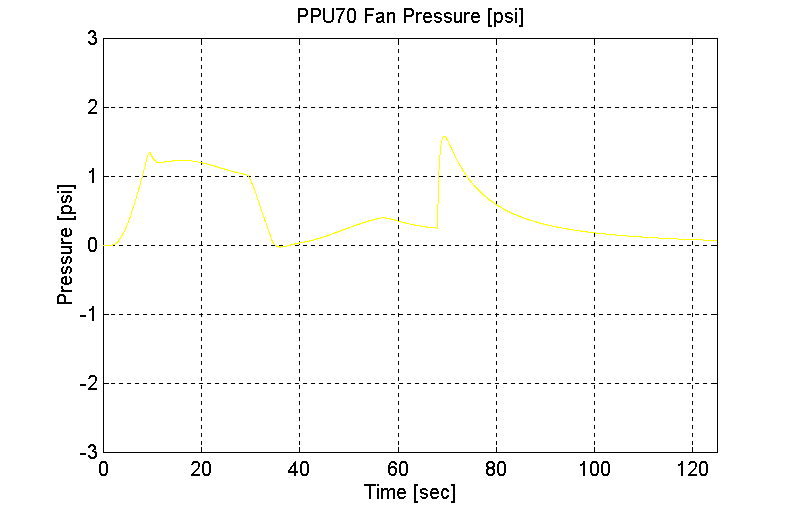
Figure 100. PPU70 Fan Pressure, Dual PPU’s, Station 1 to 2, Mid-Load Vehicle
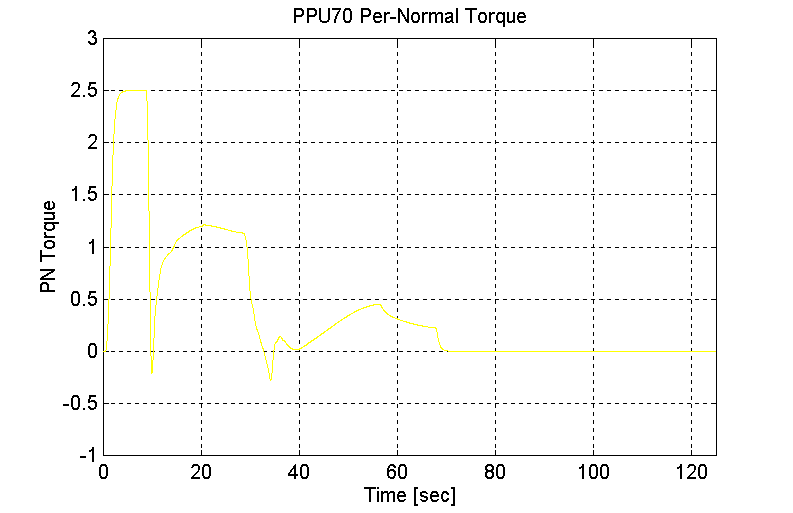
Figure 101. PPU70 Per-Normal Pressure, Dual PPU’s, Station 1 to 2, Mid-Load Vehicle
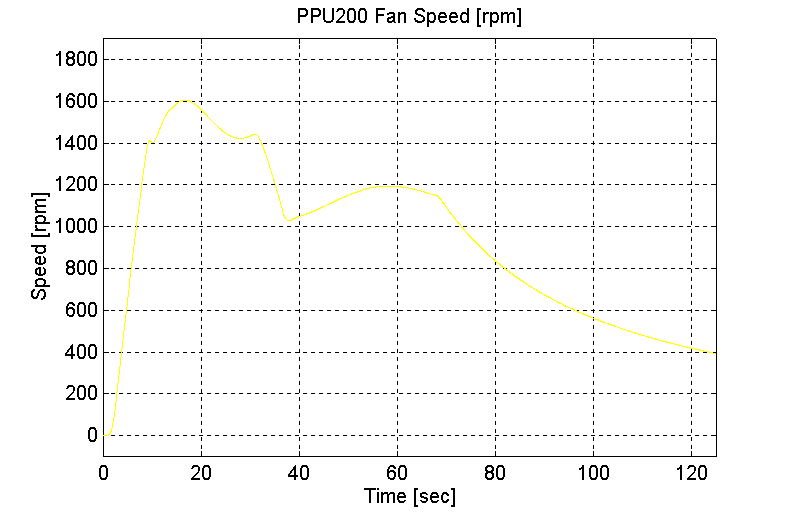
Figure 102. PPU200 Fan Speed, Dual PPU’s, Station 1 to 2, Mid-Load Vehicle
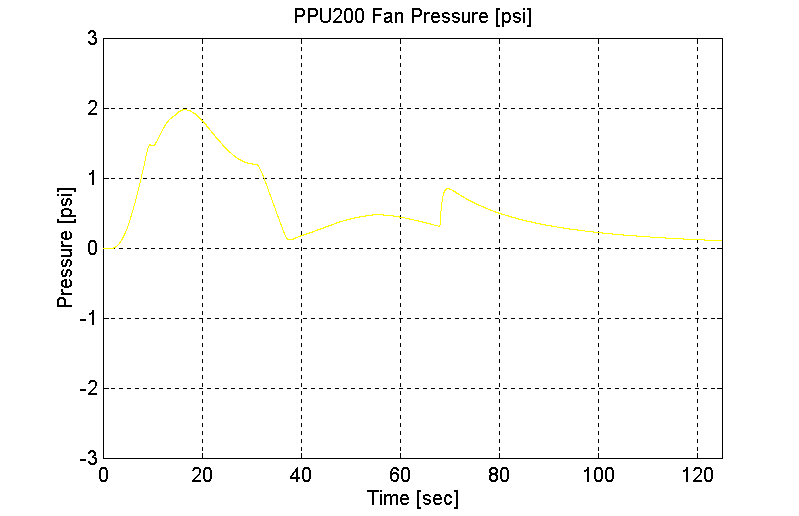
Figure 103. PPU200 Fan Pressure, Dual PPU’s, Station 1 to 2, Mid-Load Vehicle
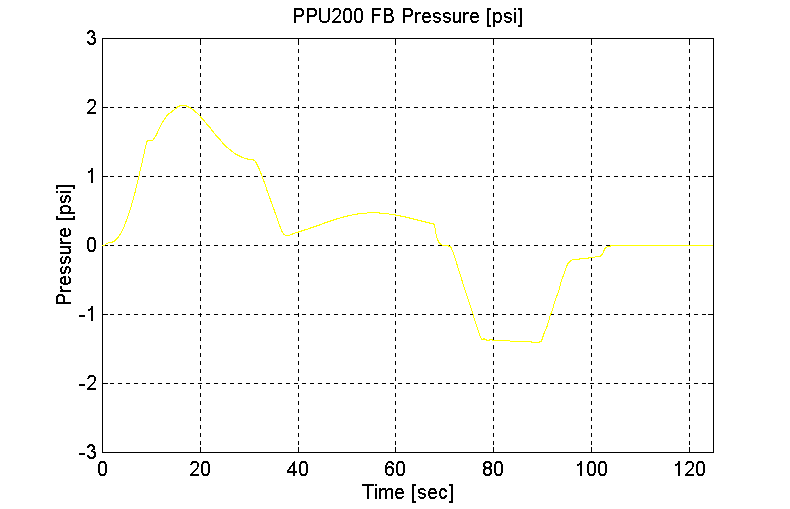
Figure 104. PPU200 FB Pressure, Dual PPU’s, Station 1 to 2, Mid-Load Vehicle
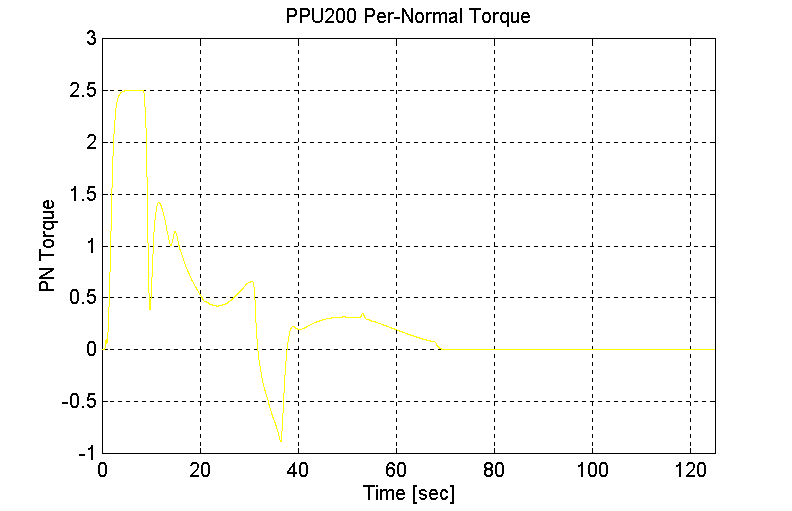
Figure 105. PPU200 Per-Normal Torque, Dual PPU’s, Station 1 to 2, Mid-Load Vehicle
Station 2 to Station 1 (PPU 200 pulling, PPU70 pushing), mid-load Vehicle, Flat grade
Grade = 0
With Brakes
Dual PPU’s
PPU70 -> PPU200
MV = 21300 [Kg]
Vmax = = 80 [kph]
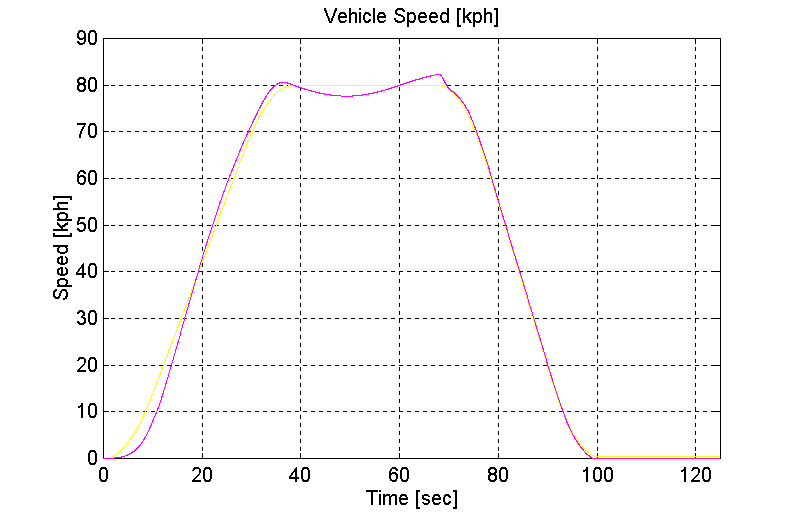
Figure 106. Vehicle Speed, Dual PPU’s, Station 2 to 1, Mid-Load Vehicle
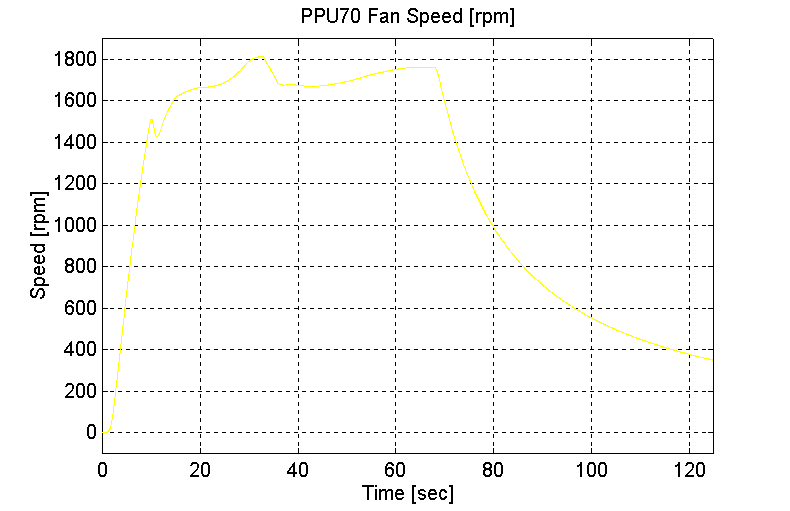
Figure 107. PPU70 Fan Speed, Dual PPU’s, Station 2 to 1, Mid-Load Vehicle
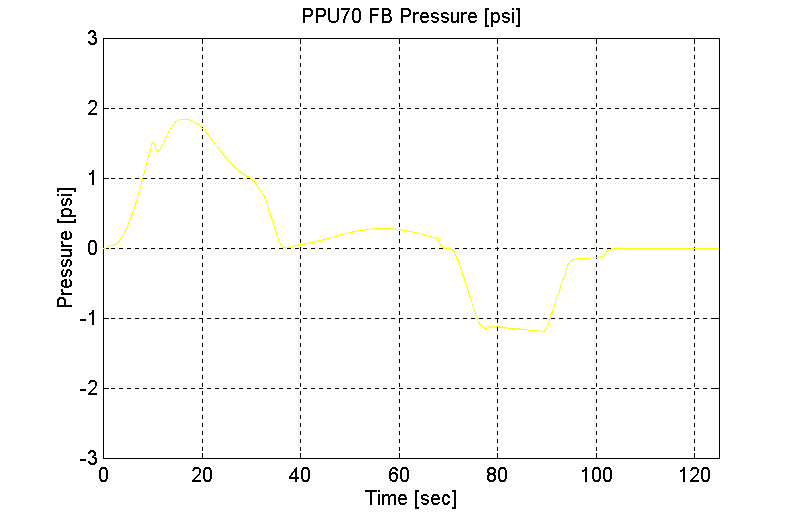
Figure 108. PPU70 FB Pressure, Dual PPU’s, Station 2 to 1, Mid-Load Vehicle
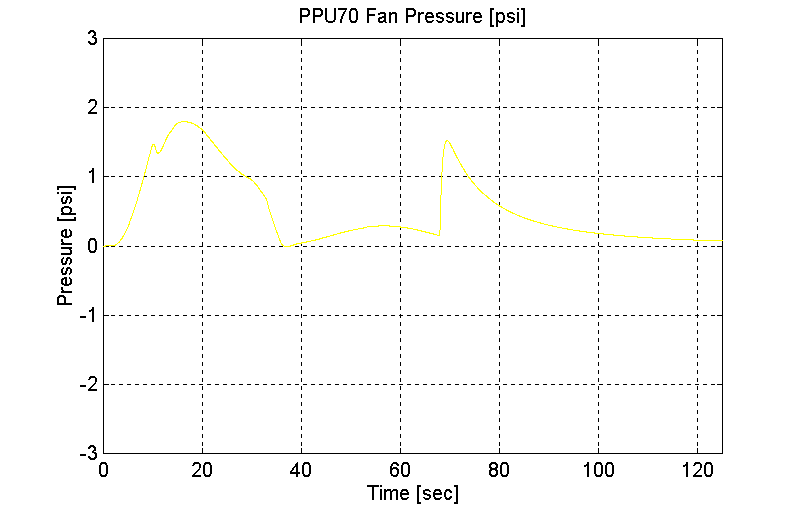
Figure 109. PPU70 Fan Pressure, Dual PPU’s, Station 2 to 1, Mid-Load Vehicle
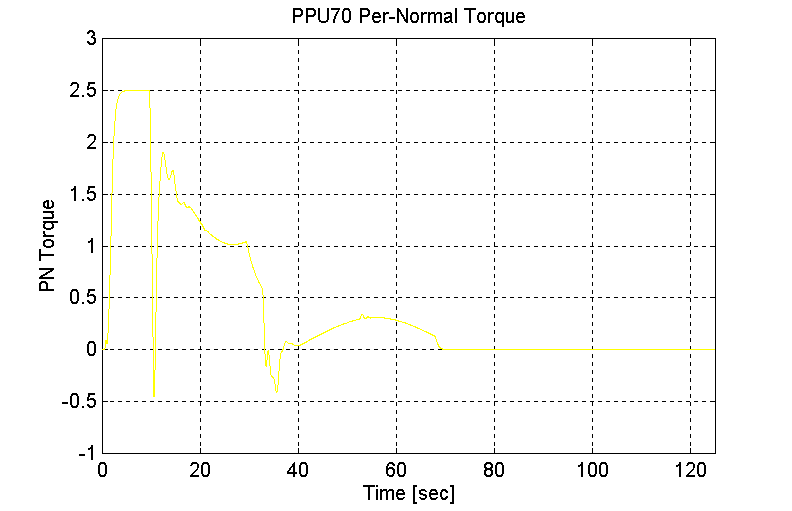
Figure 110. PPU70 Per-Normal Torque, Dual PPU’s, Station 2 to 1, Mid-Load Vehicle
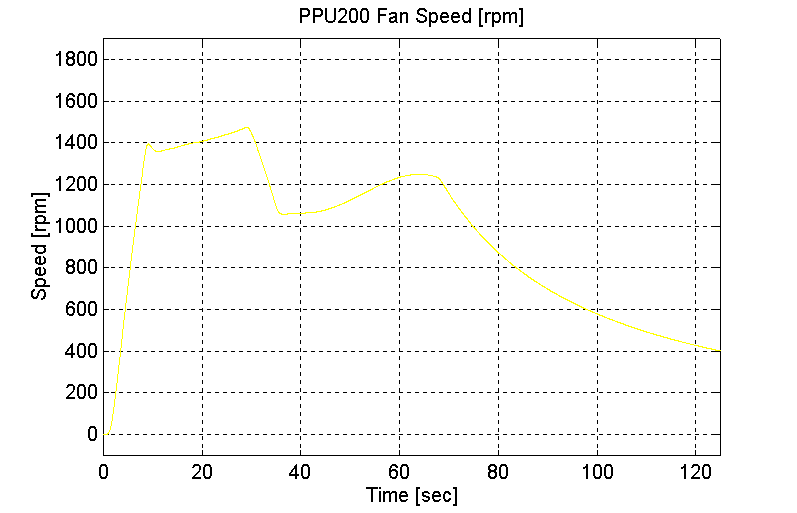
Figure 111. PPU200 Fan Speed, Dual PPU’s, Station 2 to 1, Mid-Load Vehicle
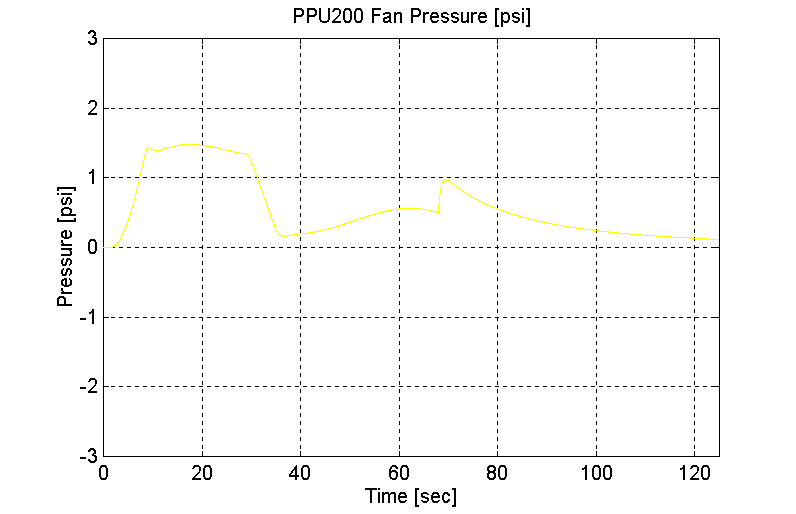
Figure 112. PPU200 Fan Pressure, Dual PPU’s, Station 2 to 1, Mid-Load Vehicle
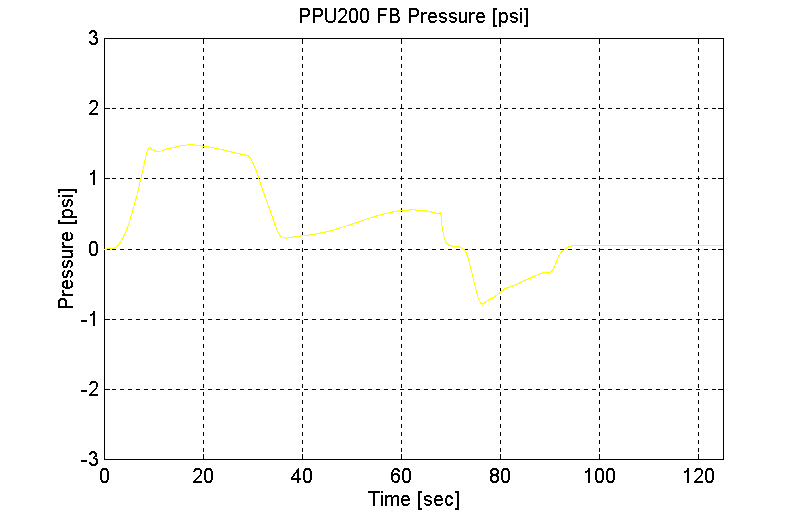
Figure 113. PPU200 FB Pressure, Dual PPU’s, Station 2 to 1, Mid-Load Vehicle
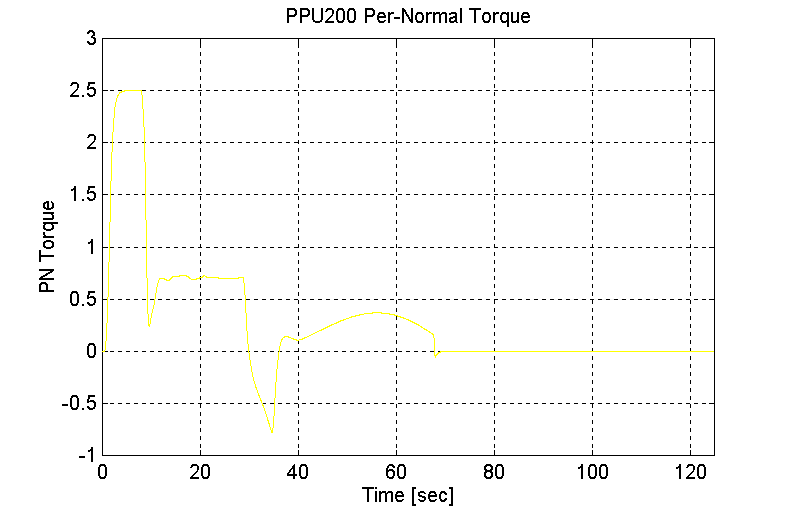
Figure 114. PPU200 Per-Normal Torque, Dual PPU’s, Station 2 to 1, Mid-Load Vehicle
Full Load (Dual PPU’s) (Vmax = 80 [kph])
Station 1 to Station 2 (PPU 200 pushing, PPU70 pulling), full Vehicle, Flat grade.
Grade = 0
With Brakes
Single PPU
PPU200 -> PPU70
MV = 30300 [Kg]
Vmax = = 80 [kph]
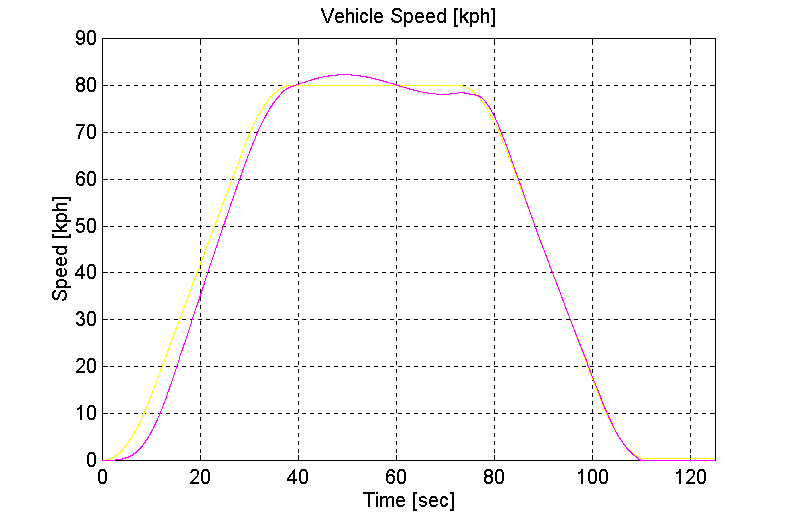
Figure 115. Vehicle Speed, Dual PPU’s, Station 1 to 2, Full-Load Vehicle
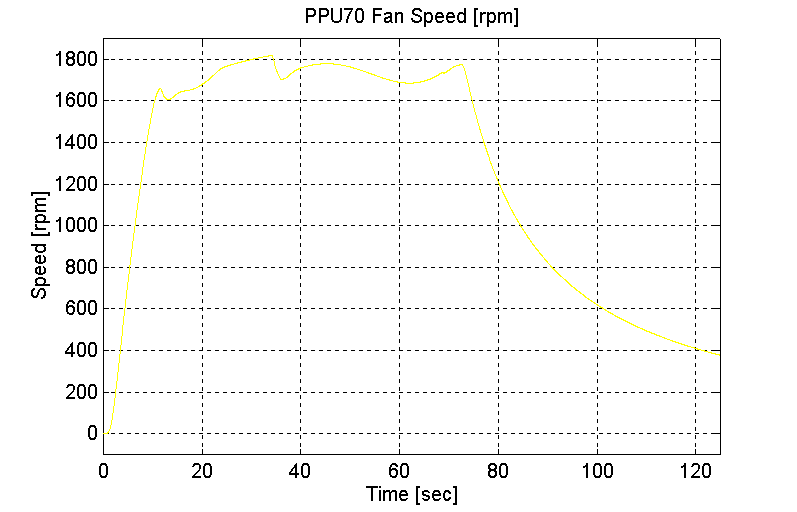
Figure 116. PPU70 Fan Speed, Dual PPU’s, Station 1 to 2, Full-Load Vehicle
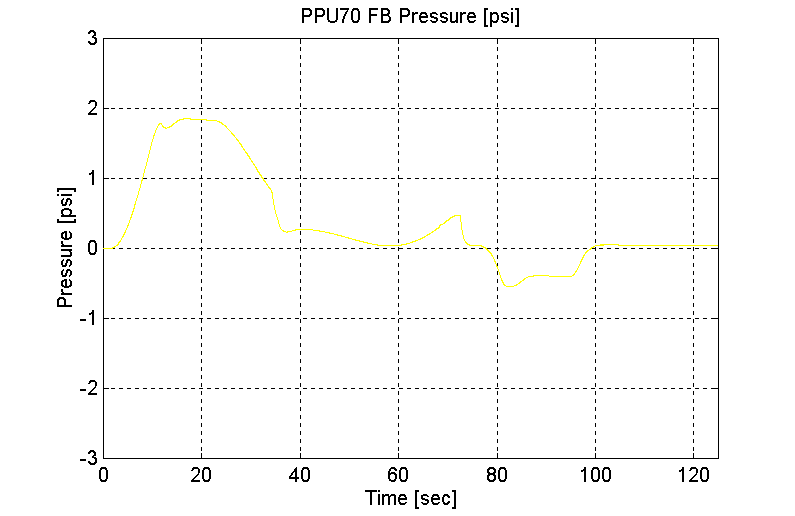
Figure 117. PPU70 FB Pressure, Dual PPU’s, Station 1 to 2, Full-Load Vehicle
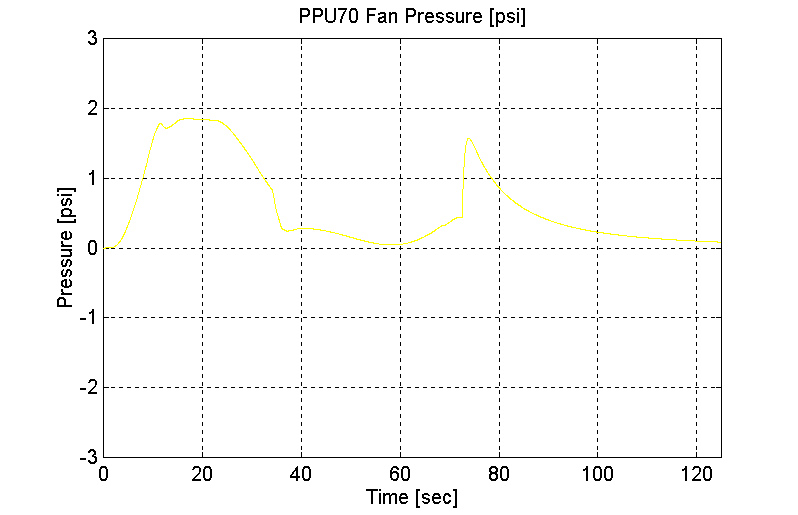
Figure 118. PPU70 Fan Pressure, Dual PPU’s, Station 1 to 2, Full-Load Vehicle
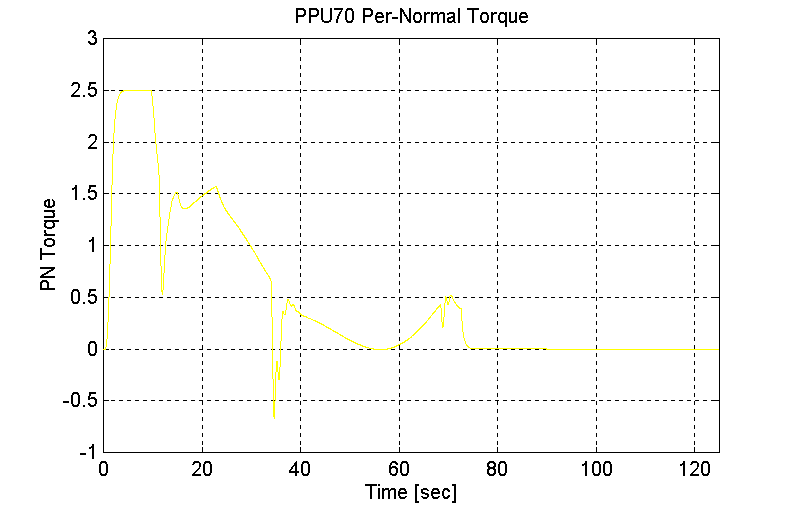
Figure 119. PPU70 Per-Normal Torque, Dual PPU’s, Station 1 to 2, Full-Load Vehicle
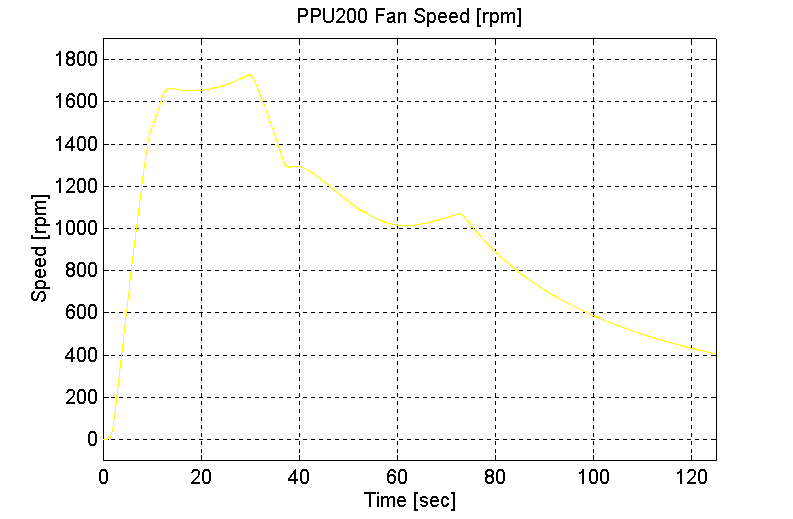
Figure 120. PPU200 Fan Speed, Dual PPU’s, Station 1 to 2, Full-Load Vehicle
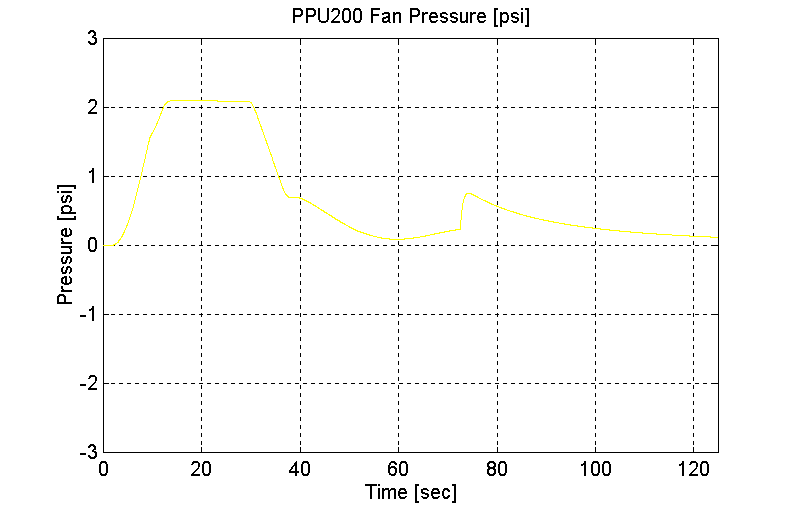
Figure 121. PPU200 Fan Pressure, Dual PPU’s, Station 1 to 2, Full-Load Vehicle
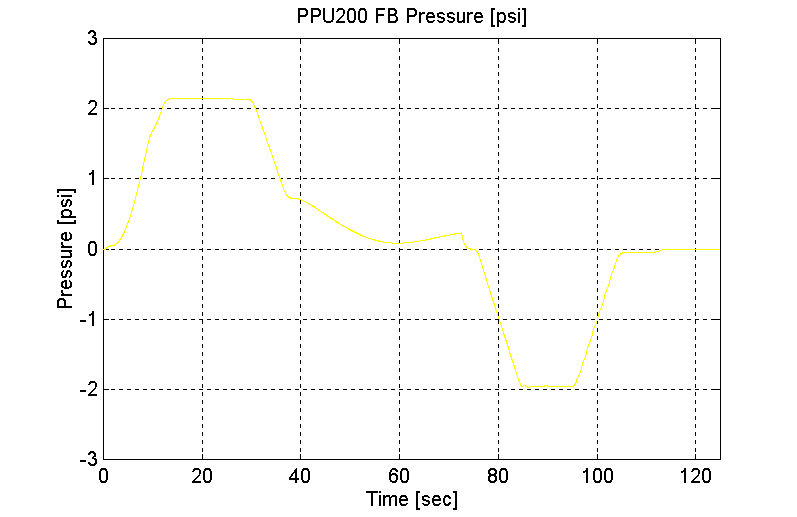
Figure 122. PPU200 FB Pressure, Dual PPU’s, Station 1 to 2, Full-Load Vehicle
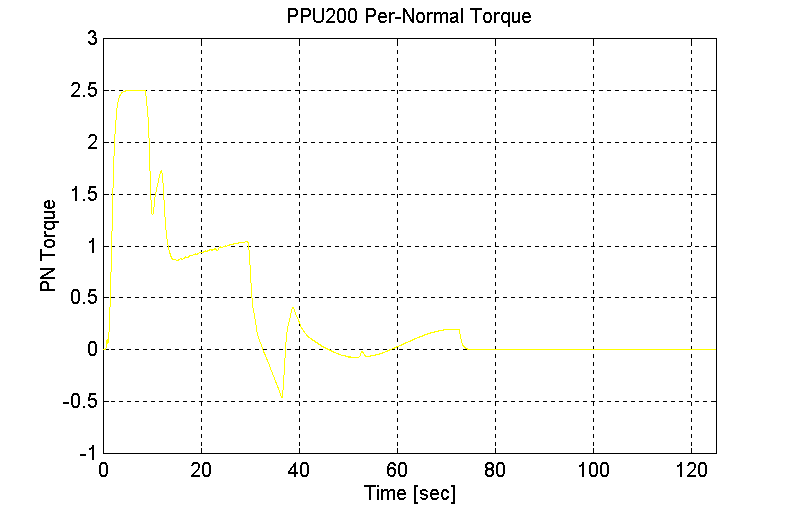
Figure 123. PPU200 Per-Normal Torque, Dual PPU’s, Station 1 to 2, Full-Load Vehicle
Station 2 to Station 1 (PPU 200 pulling, PPU70 pushing), full Vehicle, Flat grade.
Grade = 0
With Brakes
Dual PPU’s
PPU70 -> PPU200
MV = 30300 [Kg]
Vmax = = 80 [kph]
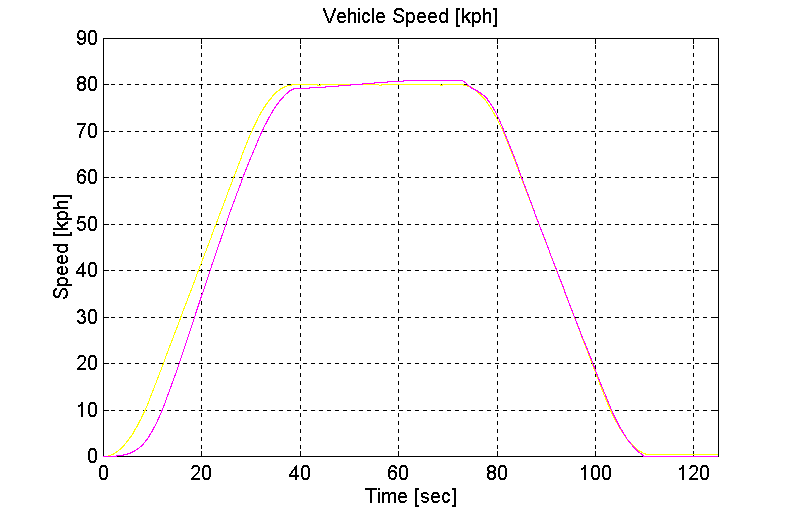
Figure 124. Vehicle Speed, Dual PPU’s, Station 2 to 1, Full-Load Vehicle
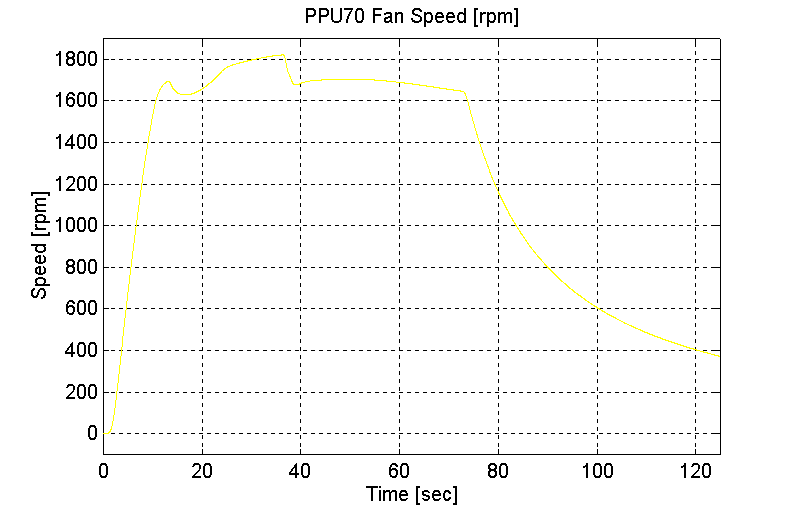
Figure 125. PPU70 Fan Speed, Dual PPU’s, Station 2 to 1, Full-Load Vehicle
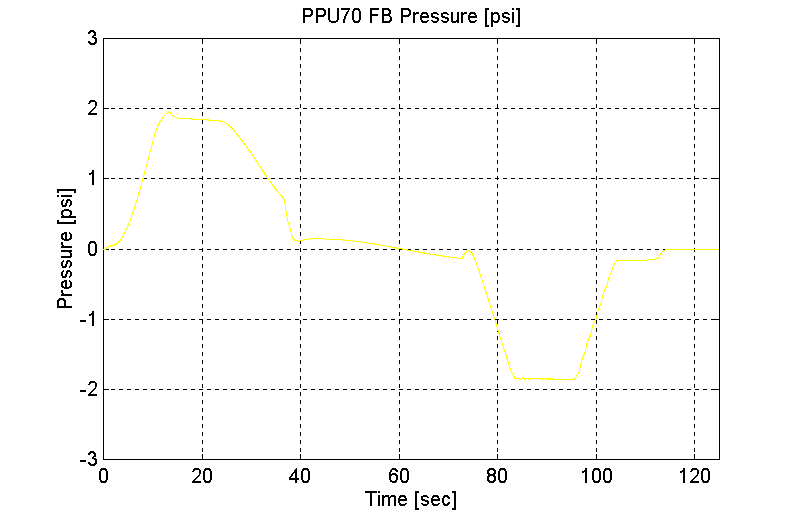
Figure 126. PPU70 FB Pressure, Dual PPU’s, Station 2 to 1, Full-Load Vehicle
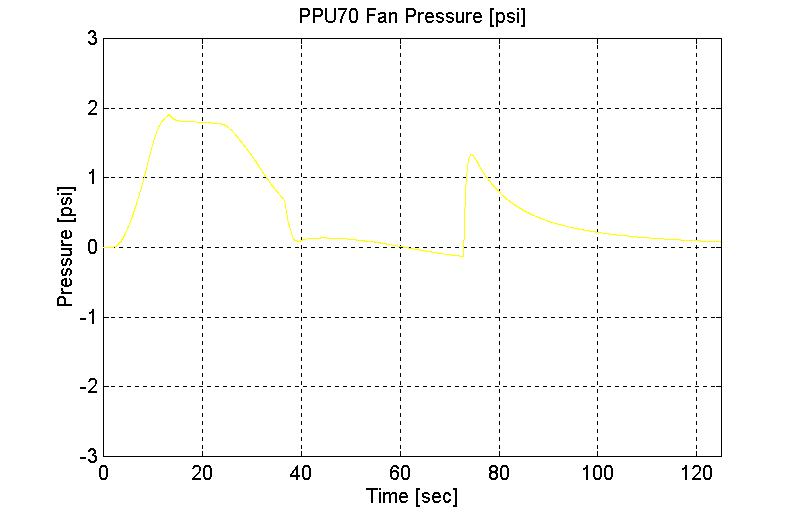
Figure 127. PPU70 Fan Pressure, Dual PPU’s, Station 2 to 1, Full-Load Vehicle
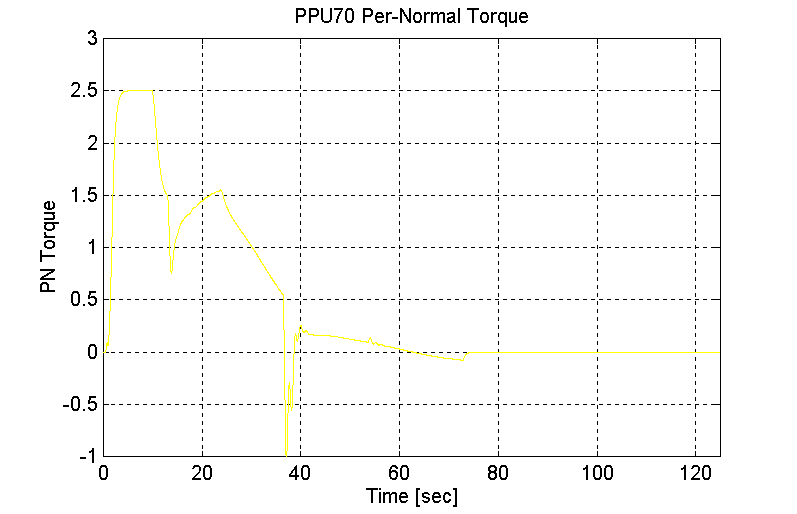
Figure 128. PPU70 Per-Normal Torque, Dual PPU’s, Station 2 to 1, Full-Load Vehicle
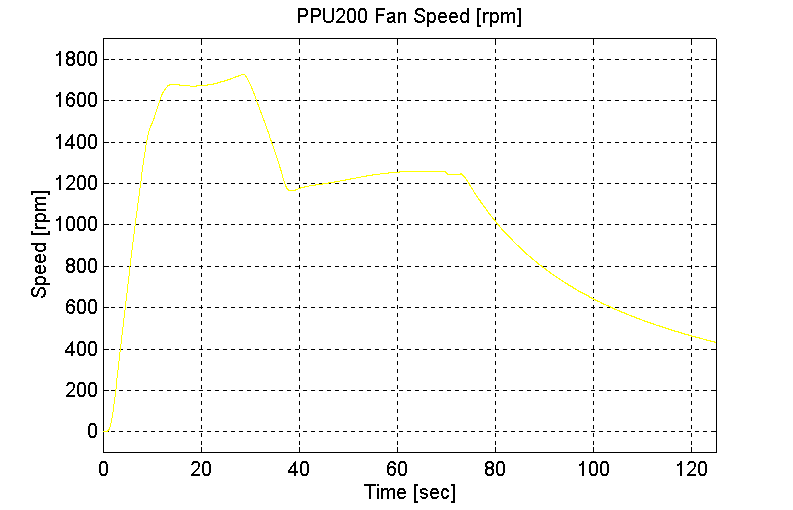
Figure 129. PPU200 Fan Speed, Dual PPU’s, Station 2 to 1, Full-Load Vehicle
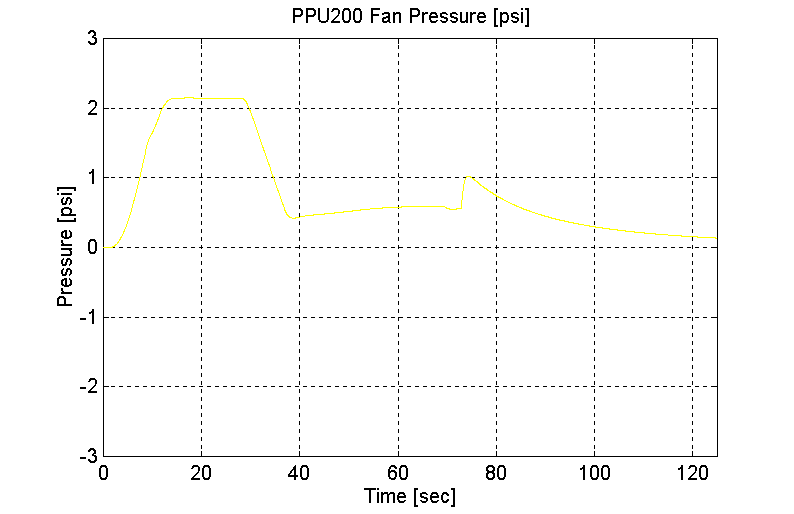
Figure 130. PPU200 Fan Pressure, Dual PPU’s, Station 2 to 1, Full-Load Vehicle
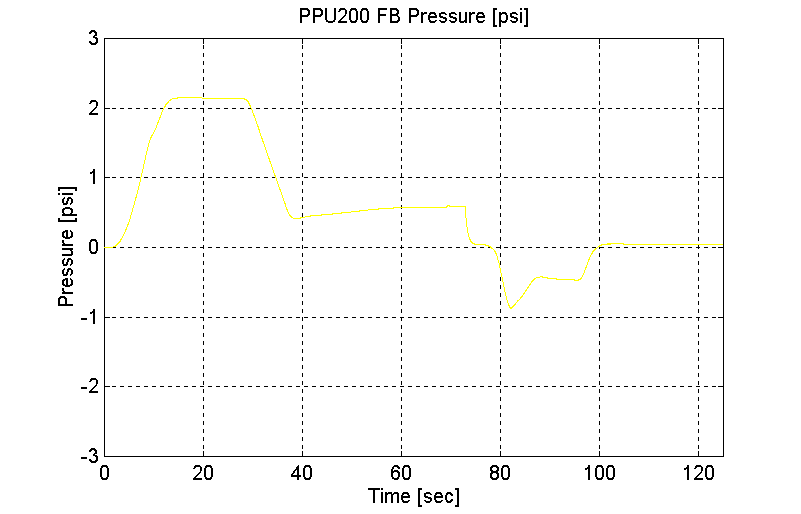
Figure 131. PPU200 FB Pressure, Dual PPU’s, Station 2 to 1, Full-Load Vehicle
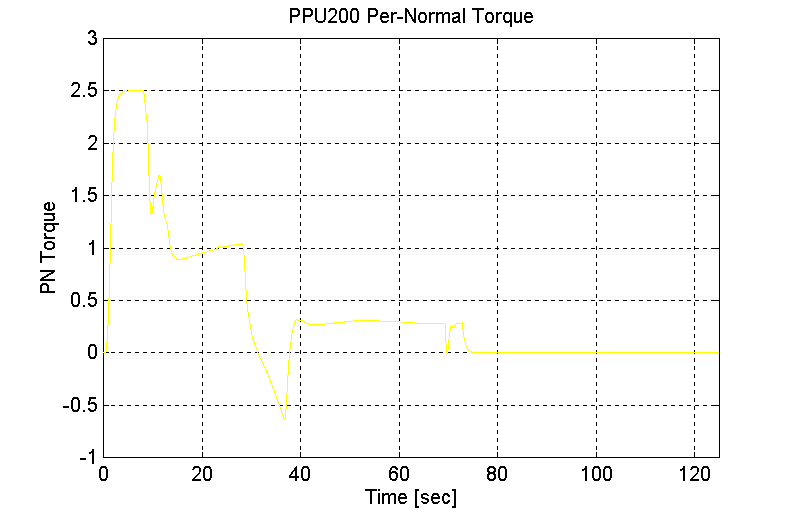
Figure 132. PPU200 Per-Normal Torque, Dual PPU’s, Station 2 to 1, Full-Load Vehicle
Empty Load (Single PPU Grade = 8) (Vmax = 80 [kph])
Station 1 to Station 2 (PPU 200 pushing), empty Vehicle, grade = 8.
Grade = 8
With Brakes
Single PPU
PPU200 -> PPU70
MV = 12300 [Kg]
Vmax = = 80 [kph]
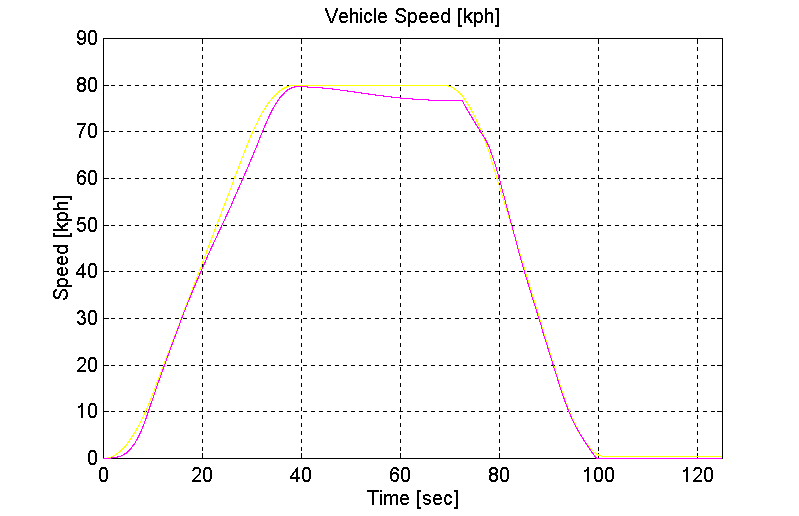
Figure 133. Vehicle Speed, Single PPU, Station 1 to 2, Empty Vehicle (Grade=8)
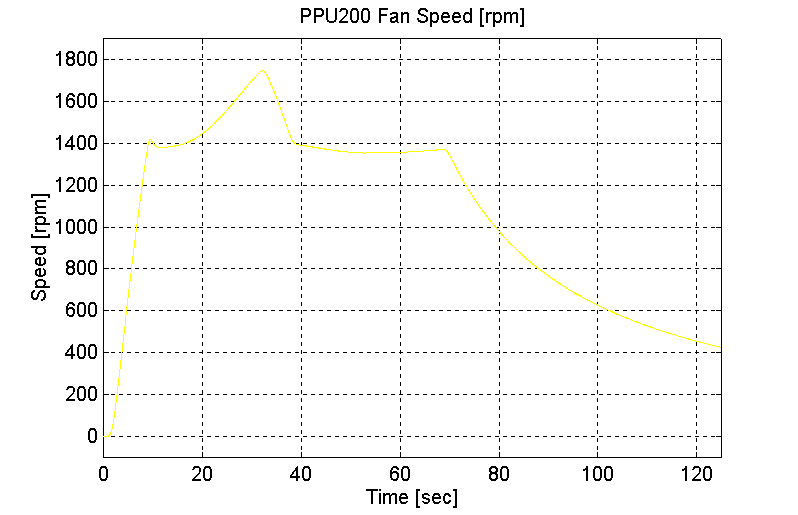
Figure 134. PPU200 Fan Speed, Single PPU, Station 1 to 2, Empty Vehicle (Grade=8)
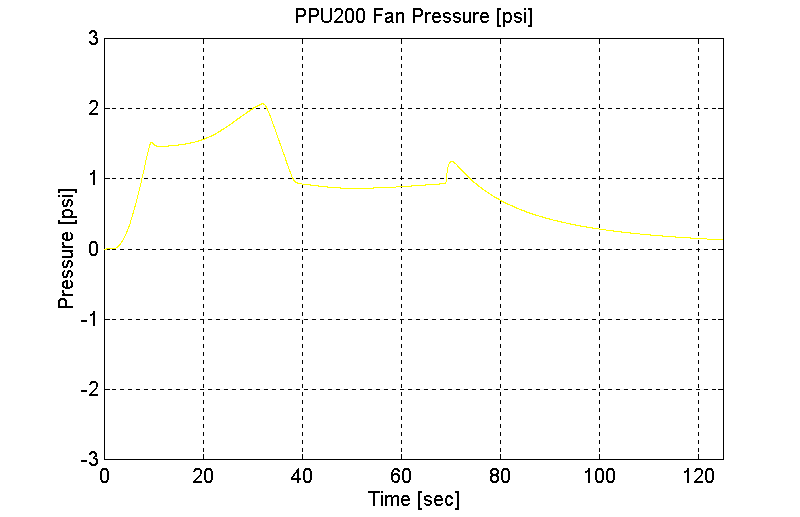
Figure 135. PPU200 Fan Pressure, Single PPU, Station 1 to 2, Empty Vehicle (Grade=8)
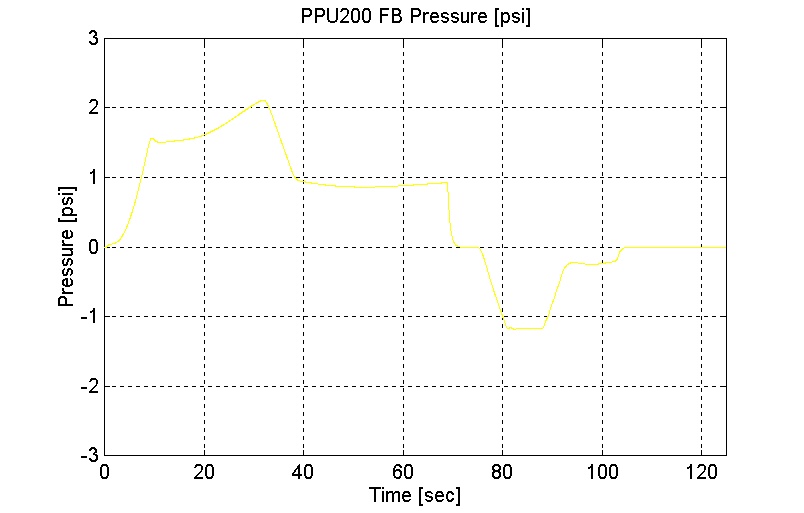
Figure 136. PPU200 FB Pressure, Single PPU, Station 1 to 2, Empty Vehicle (Grade=8)
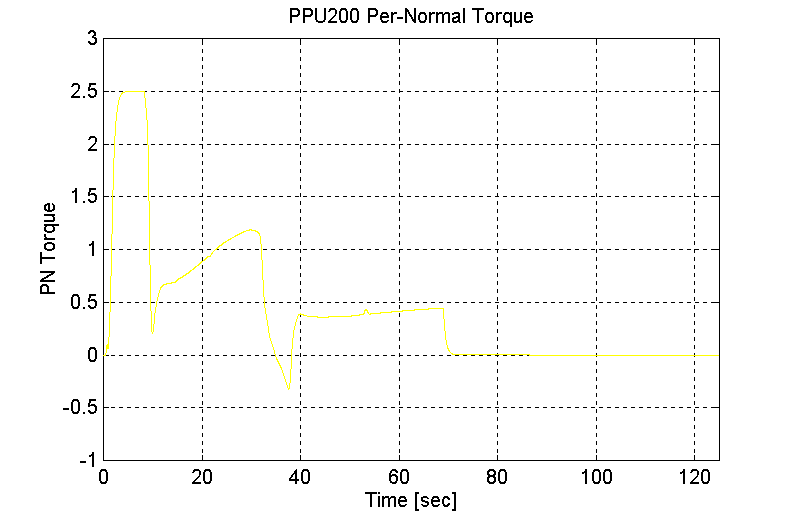
Figure 137. PPU200 PN Torque, Single PPU, Station 1 to 2, Empty Vehicle (Grade=8)
Average Load (Dual PPU’s Grade = 8) (Vmax = 80 [kph])
Station 1 to Station 2 (PPU 200 pushing, PPU70 pulling), mid-load Vehicle, grade = 8.
Grade = 8
With Brakes
Dual PPU’s
PPU200 -> PPU70
MV = 21300 [Kg]
Vmax = = 80 [kph]
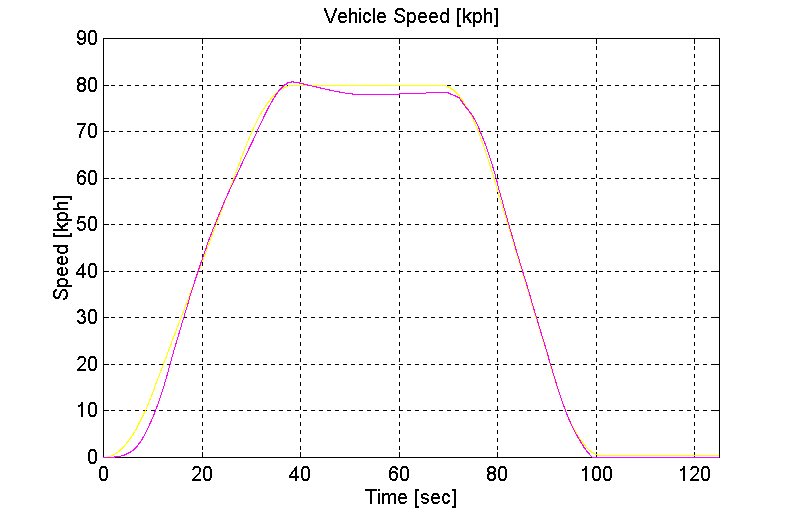
Figure 138. Vehicle Speed, Dual PPU’s, Station 1 to 2, Mid-Load Vehicle (Grade=8)
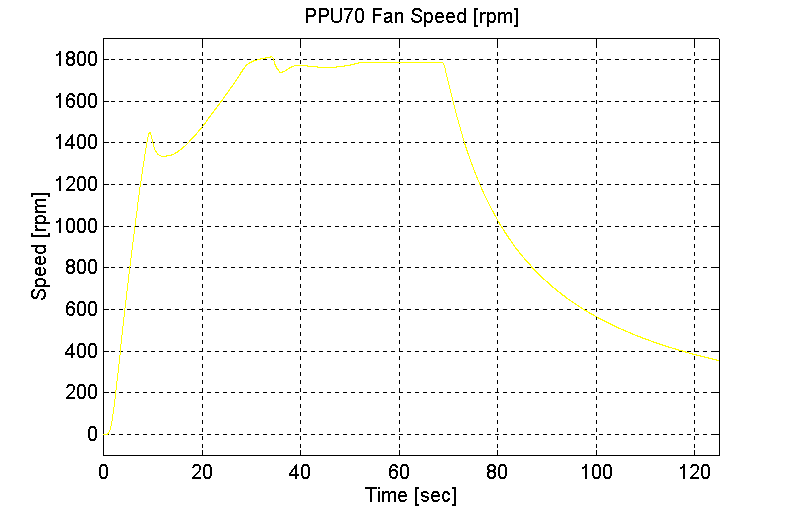
Figure 139. PPU70 Fan Speed, Dual PPU’s, Station 1 to 2, Mid-Load Vehicle (Grade=8)
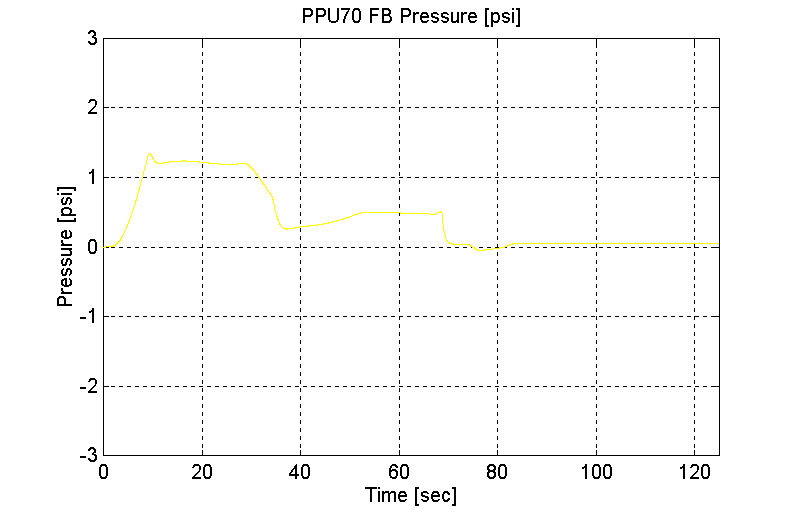
Figure 140. PPU70 FB Pressure, Dual PPU’s, Station 1 to 2, Mid-Load Vehicle (Grade=8)
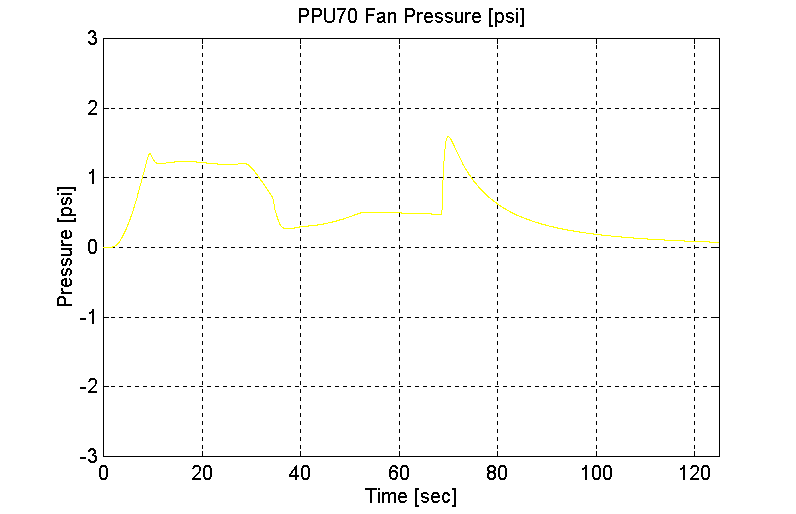
Figure 141. PPU70 Fan Pressure, Dual PPU’s, Station 1 to 2, Mid-Load Vehicle (Grade=8)
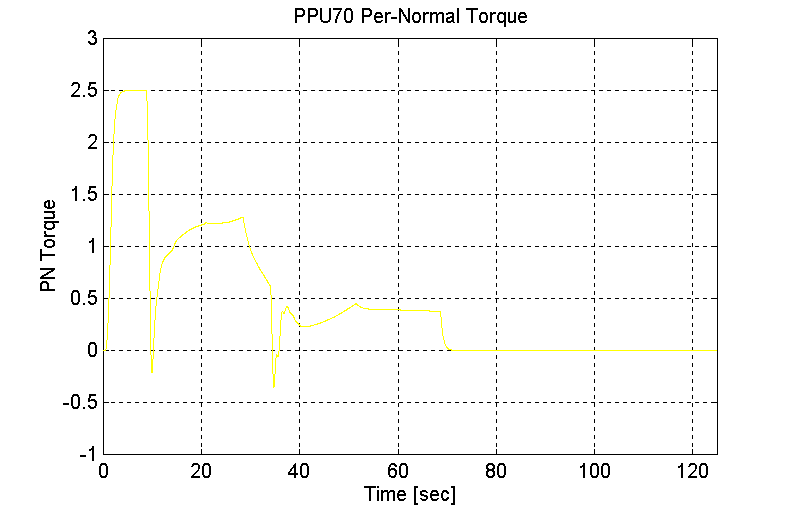
Figure 142. PPU70 PN Torque, Dual PPU’s, Station 1 to 2, Mid-Load Vehicle (Grade=8)
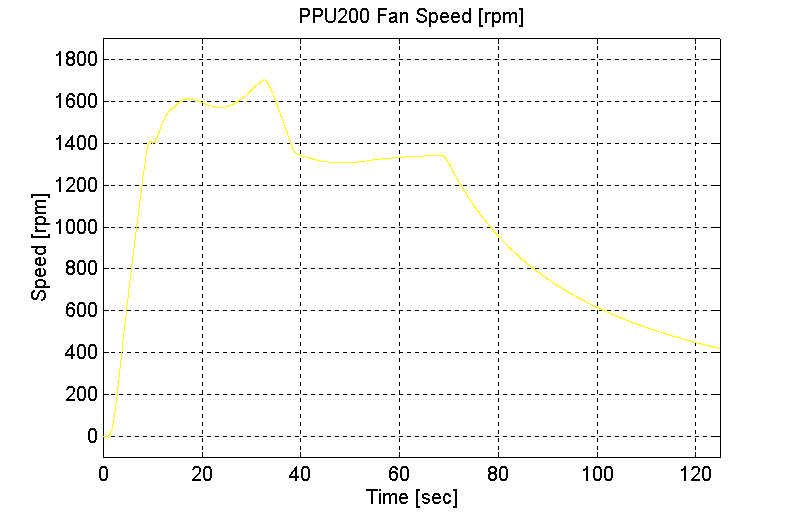
Figure 143. PPU200 Fan Speed, Dual PPU’s, Station 1 to 2, Mid-Load Vehicle (Grade=8)
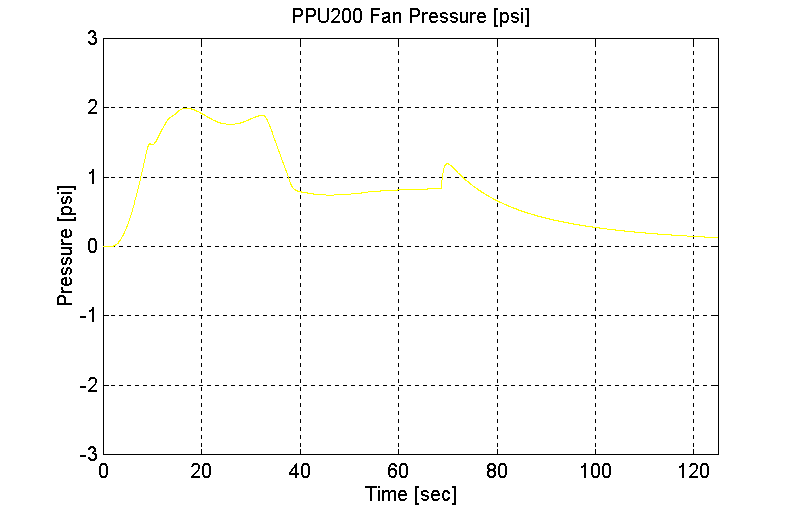
Figure 144. PPU200 Fan Pressure, Dual PPU’s, Station 1 to 2, Mid-Load Vehicle (Grade=8)
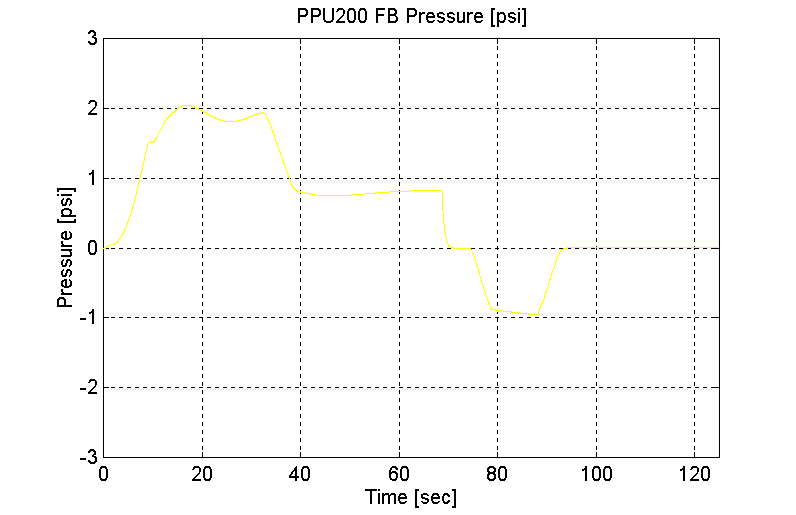
Figure 145. PPU200 FB Pressure, Dual PPU’s, Station 1 to 2, Mid-Load Vehicle (Grade=8)
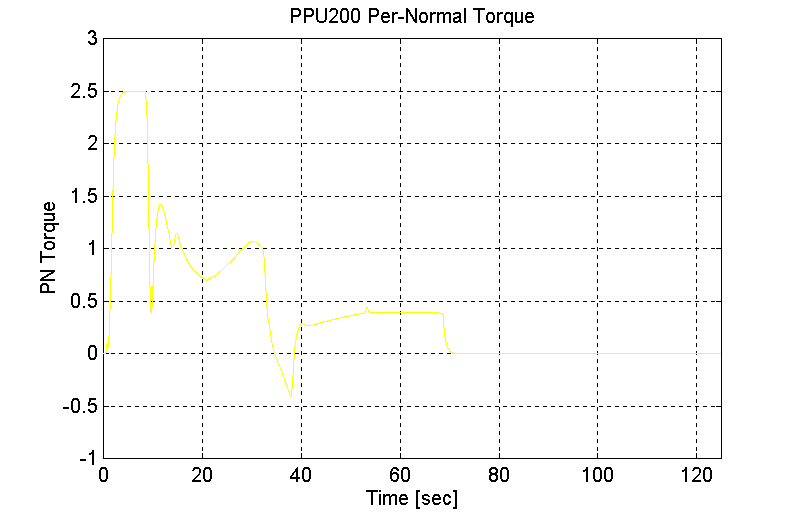
Figure 146. PPU200 PN Torque, Dual PPU’s, Station 1 to 2, Mid-Load Vehicle (Grade=8)
Full Load (Dual PPU’s Grade = 8) (Vmax = 80 [kph])
Station 2 to Station 1 (PPU 200 pulling, PPU70 pushing), full Vehicle, grade = 8.
Grade = 8
With Brakes
Dual PPU’s
PPU70 -> PPU200
MV = 30300 [Kg]
Vmax = = 80 [kph]
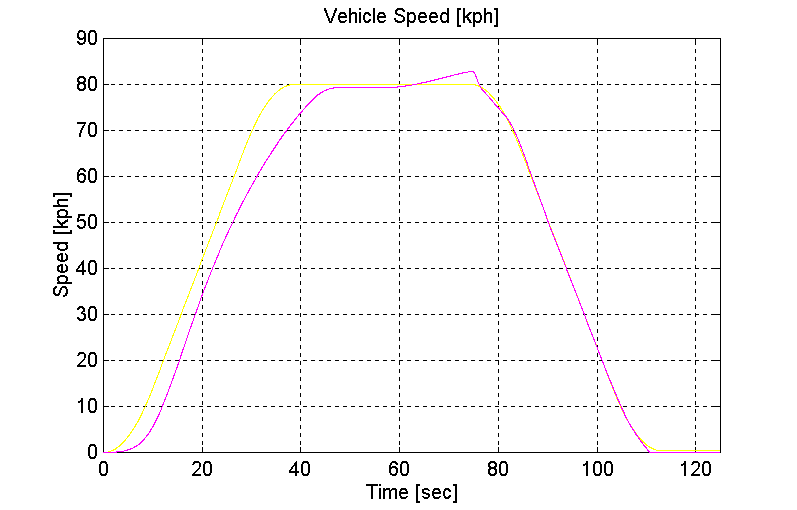
Figure 147. Vehicle Speed, Dual PPU’s, Station 2 to 1, Full-Load Vehicle (Grade=8)
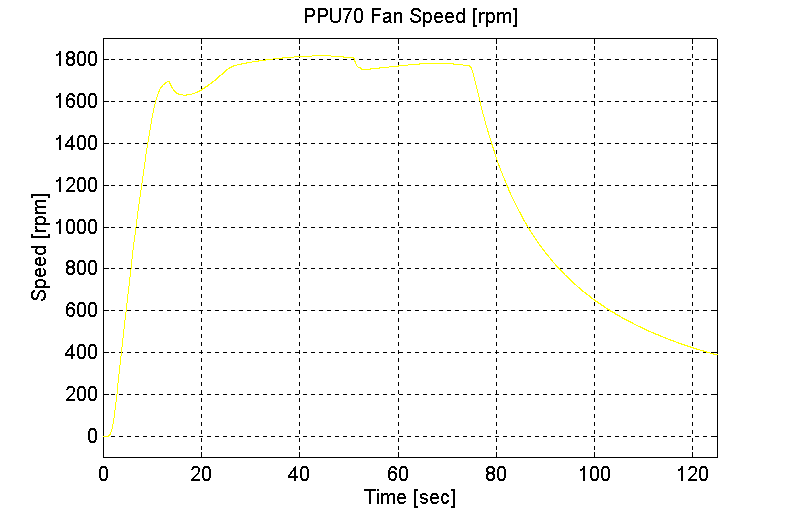
Figure 148. PPU70 Fan Speed, Dual PPU’s, Station 2 to 1, Full-Load Vehicle (Grade=8)
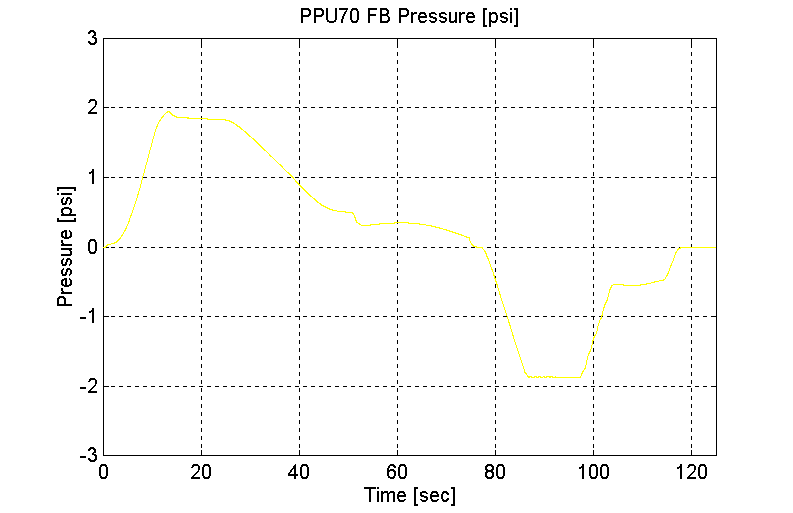
Figure 149. PPU70 FB Pressure, Dual PPU’s, Station 2 to 1, Full-Load Vehicle (Grade=8)
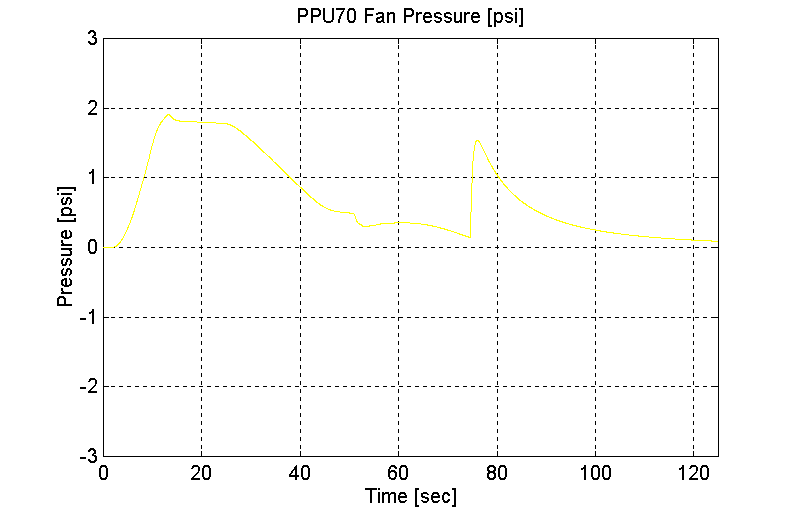
Figure 150. PPU70 Fan Pressure, Dual PPU’s, Station 2 to 1, Full-Load Vehicle (Grade=8)
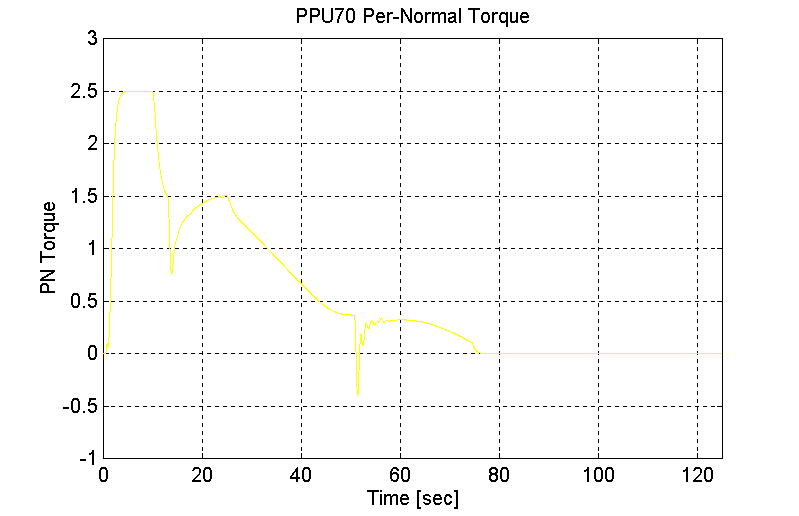
Figure 151. PPU70 PN Torque, Dual PPU’s, Station 2 to 1, Full-Load Vehicle (Grade=8)
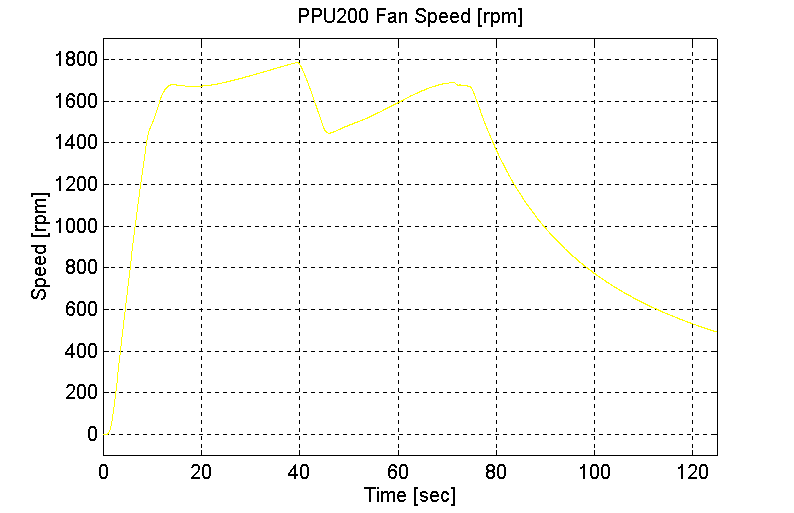
Figure 152. PPU200 Fan Speed, Dual PPU’s, Station 2 to 1, Full-Load Vehicle (Grade=8)
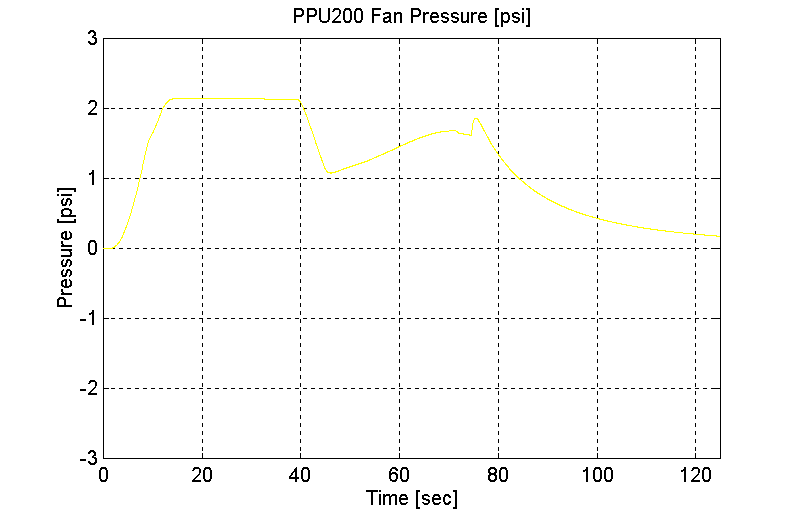
Figure 153. PPU200 Fan Pressure, Dual PPU’s, Station 2 to 1, Full-Load Vehicle (Grade=8)
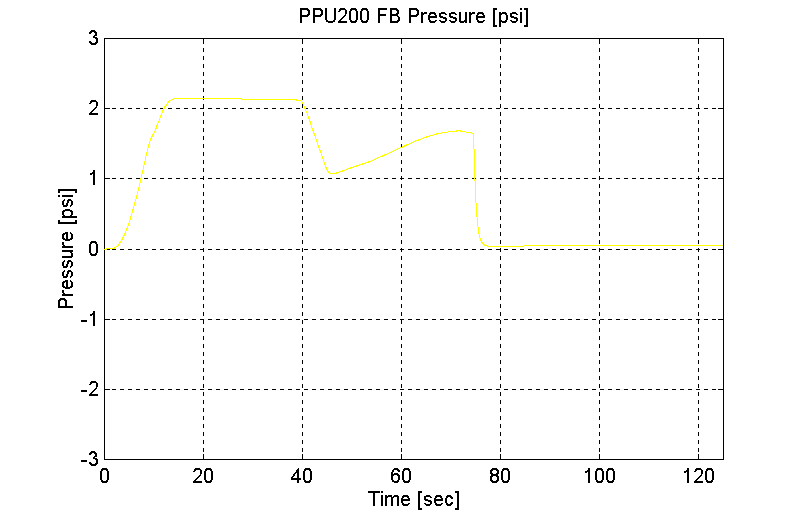
Figure 154. PPU200 FB Pressure, Dual PPU’s, Station 2 to 1, Full-Load Vehicle (Grade=8)

Figure 155. PPU200 PN Torque, Dual PPU’s, Station 2 to 1, Full-Load Vehicle (Grade=8)
Empty Load (Single PPU’s Grade = 0, Vmax = 50 [kph])
Station 2 to Station 1 (PPU 200 pulling), Empty Vehicle, grade = 0.
Grade = 0
With Brakes
Single PPU
PPU70 -> PPU200
MV = 12300 [Kg]
Vmax = = 50 [kph]
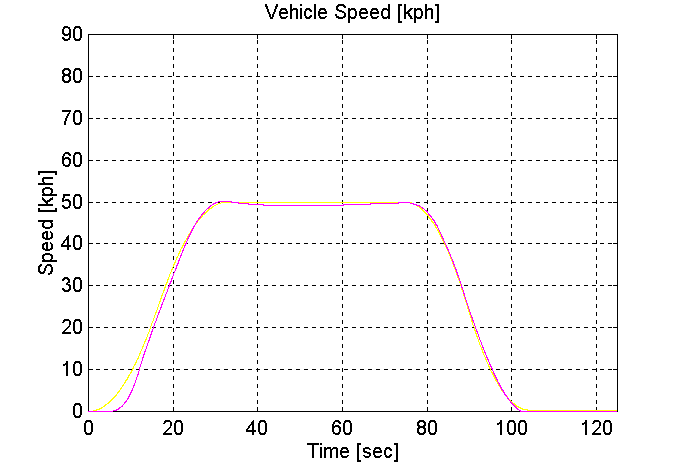
Figure 156. Vehicle Speed, Single PPU, Station 2 to 1, Empty Vehicle (Grade=0)
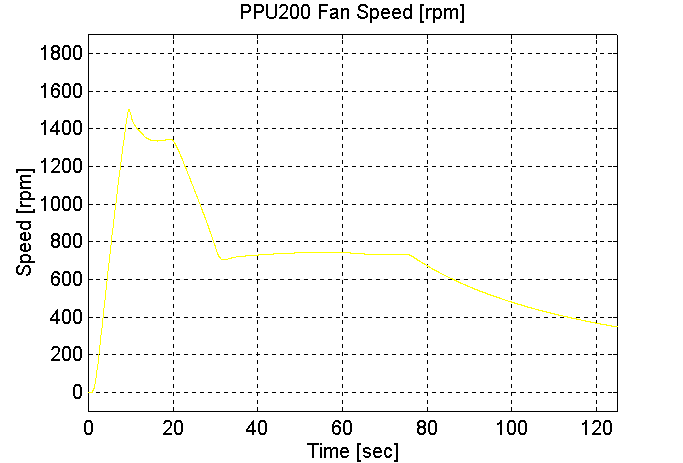
Figure 157. PPU200 Fan Speed, Single PPU, Station 2 to 1, Empty Vehicle (Grade=0)
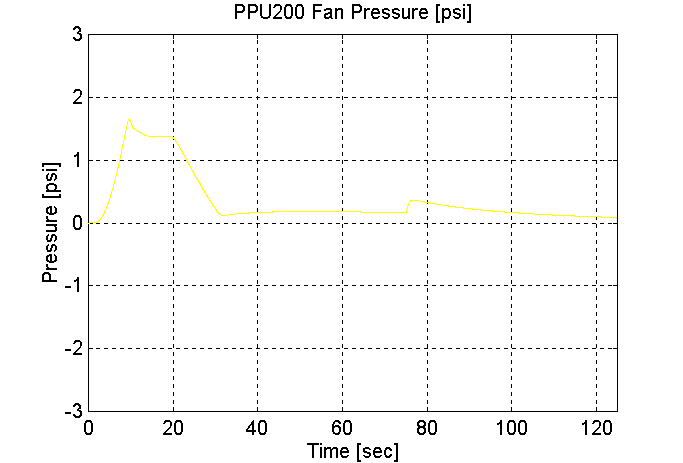
Figure 158. PPU200 Fan Pressure, Single PPU, Station 2 to 1, Empty Vehicle (Grade=0)
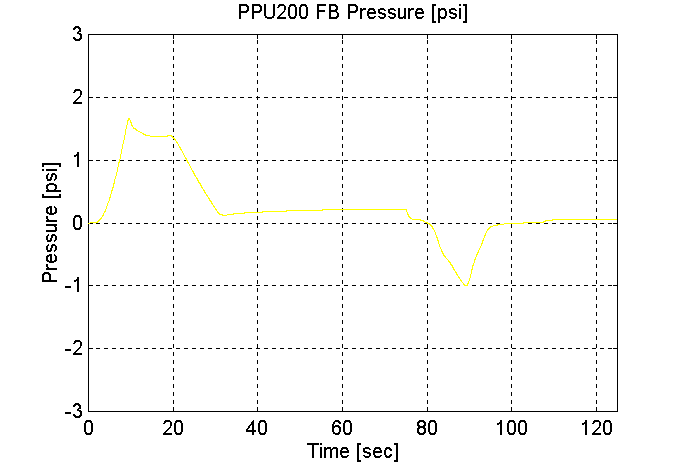
Figure 159. PPU200 FB Pressure, Single PPU, Station 2 to 1, Empty Vehicle (Grade=0)
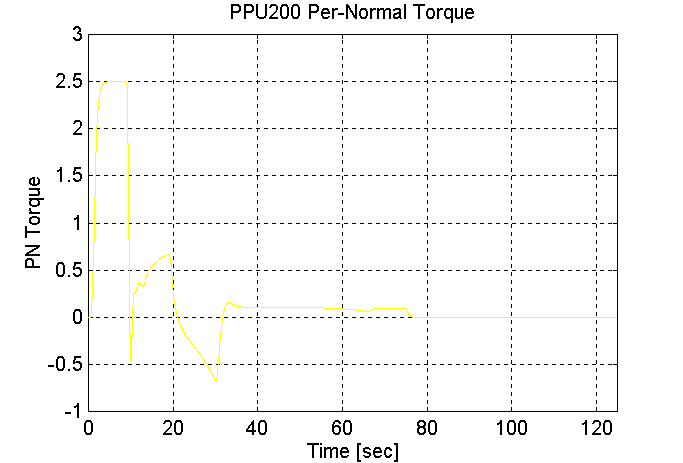
Figure 160. PPU200 PN Torque, Single PPU, Station 2 to 1, Empty Vehicle (Grade=0)
Mid Load (Single PPU’s Grade = 0, Vmax = 50 [kph])
Station 1 to Station 2 (PPU 200 pushing), Mid-load Vehicle, grade = 0.
Grade = 0
With Brakes
Single PPU
PPU200 -> PPU70
MV = 21300 [Kg]
Vmax = = 50 [kph]
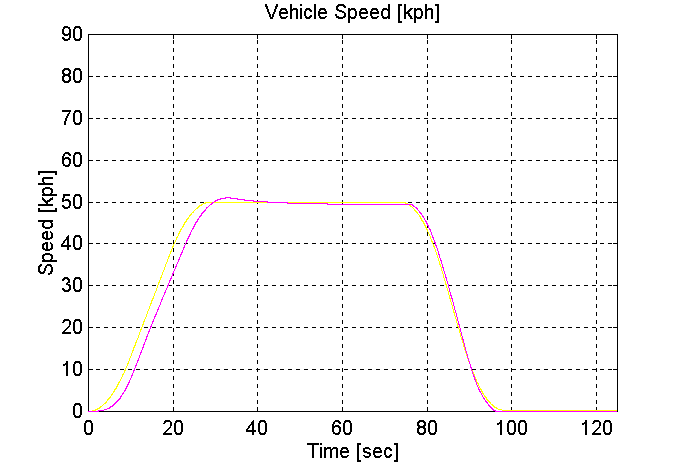
Figure 161. Vehicle Speed, Single PPU, Station 1 to 2, Mid-load Vehicle (Grade=0)
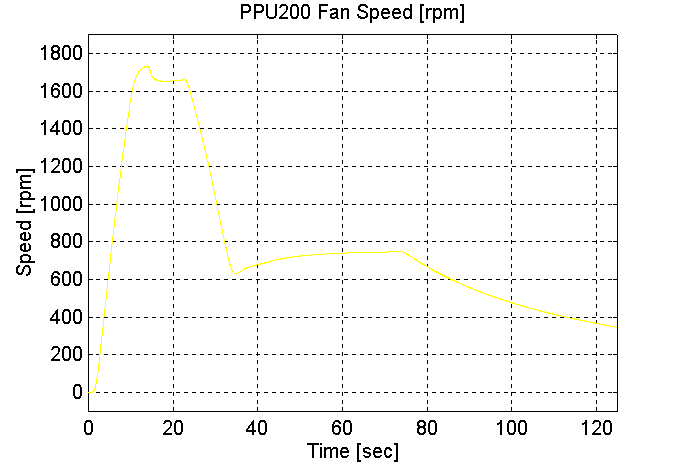
Figure 162. PPU200 Fan Speed, Single PPU, Station 1 to 2, Mid-load Vehicle (Grade=0)
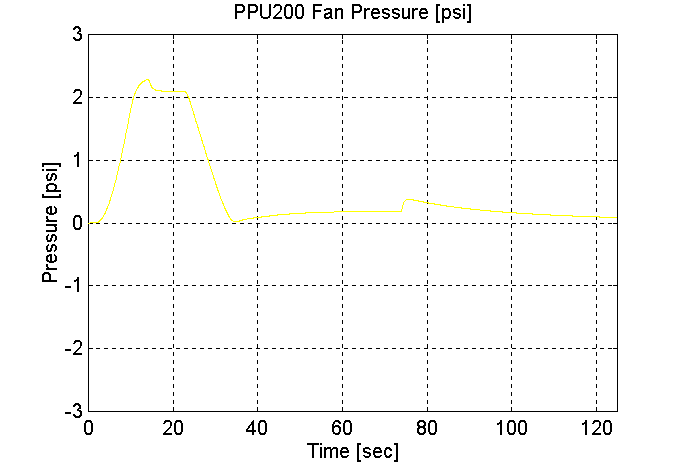
Figure 163. PPU200 Fan Pressure, Single PPU, Station 1 to 2, Mid-load Vehicle (Grade=0)

Figure 164. PPU200 FB Pressure, Single PPU, Station 1 to 2, Mid-load Vehicle (Grade=0)
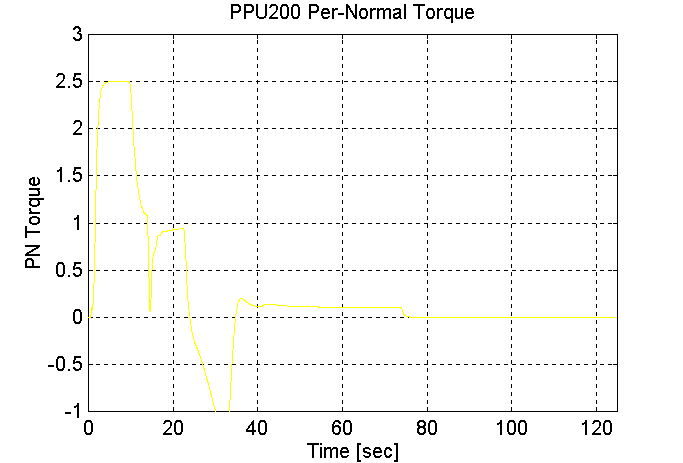
Figure 165. PPU200 PN Torque, Single PPU, Station 1 to 2, Mid-load Vehicle (Grade=0)
Full Load (Single PPU’s Grade = 0, Vmax = 50 [kph])
Station 2 to Station 1 (PPU 200 pulling), Full-load Vehicle, grade = 0.
Grade = 0
With Brakes
Single PPU
PPU70 -> PPU200
MV = 30300 [Kg]
Vmax = = 50 [kph]
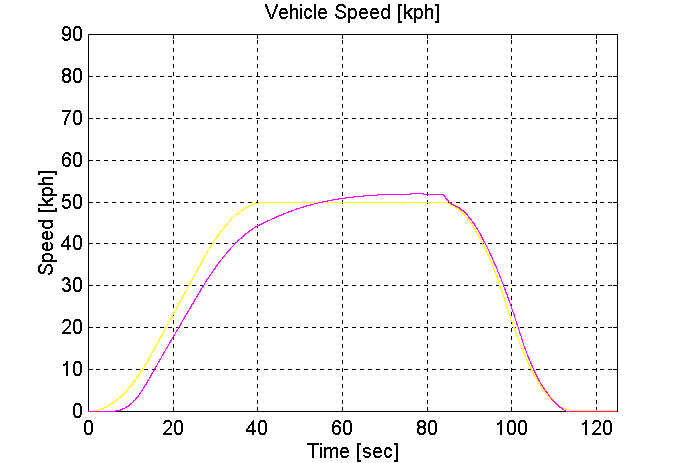
Figure 166. Vehicle Speed, Single PPU, Station 2 to 1, Full-load Vehicle (Grade=0)
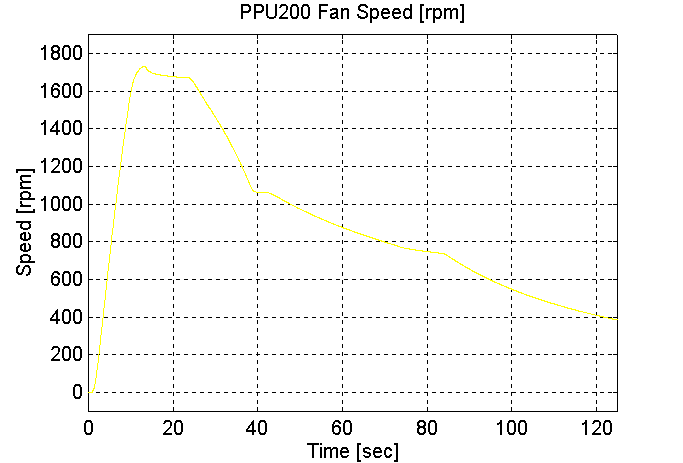
Figure 167. PPU200 Fan Speed, Single PPU, Station 2 to 1, Full-load Vehicle (Grade=0)
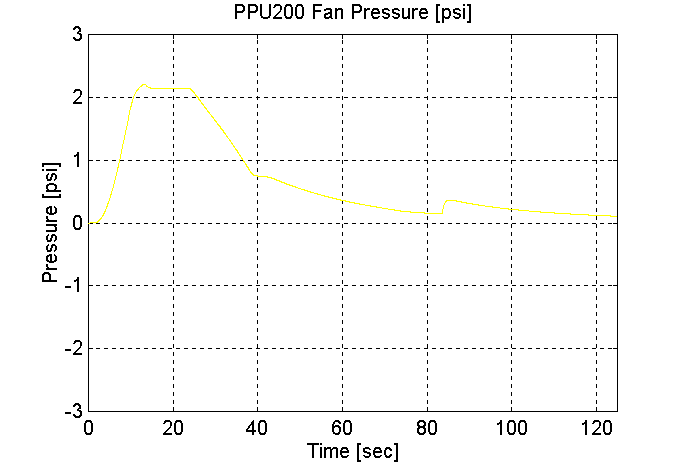
Figure 168. PPU200 FB Pressure, Single PPU, Station 2 to 1, Full-load Vehicle (Grade=0)
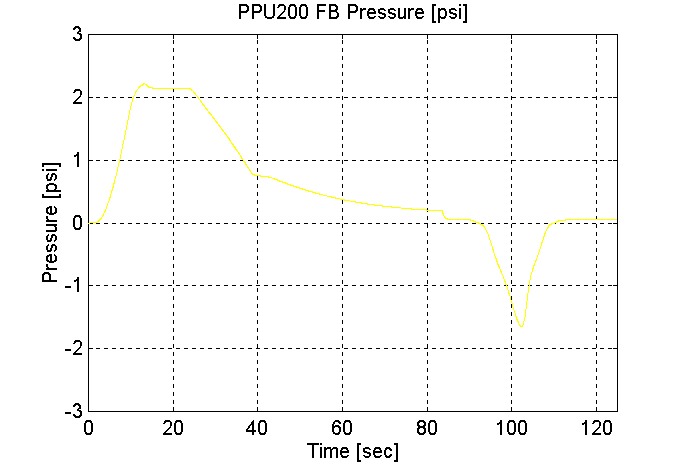
Figure 169. PPU200 Fan Pressure, Single PPU, Station 2 to 1, Full-load Vehicle (Grade=0)
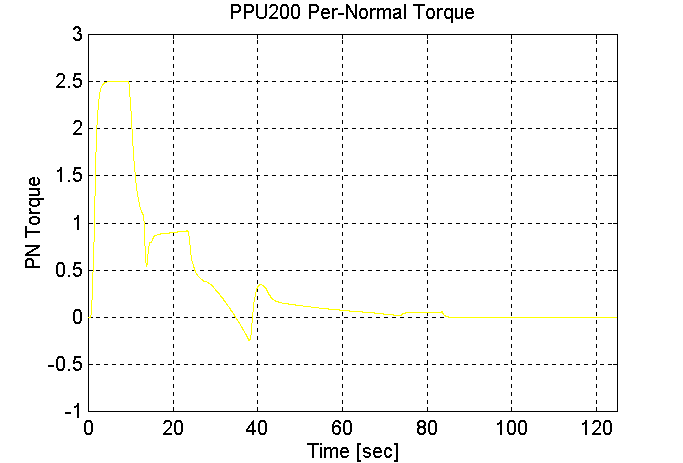
Figure 170. PPU200 PN Torque, Single PPU, Station 2 to 1, Full-load Vehicle (Grade=0)
Empty Load (Dual PPU’s Grade = 0 Vmax = 50 [kph)
Station 1 to Station 2 (PPU 200 pushing, PPU70 pulling), empty Vehicle, grade = 0.
Grade = 0
With Brakes
Dual PPU’s
PPU200 -> PPU70
MV = 12300 [Kg]
Vmax = = 50 [kph]
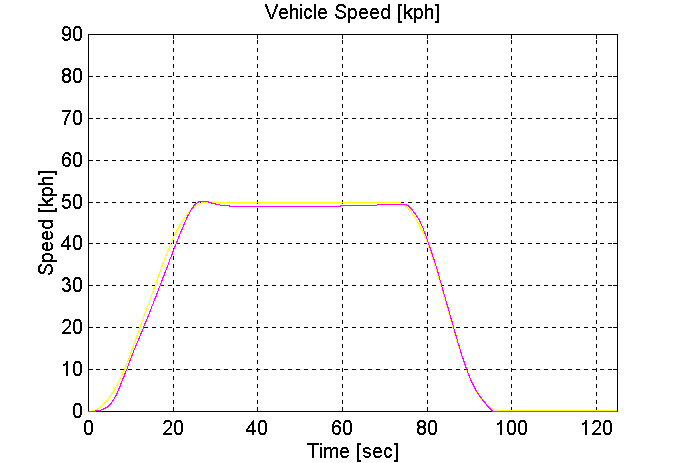
Figure 171. Vehicle Speed, Dual PPU’s, Station 1 to 2, Empty Vehicle (Grade=0)
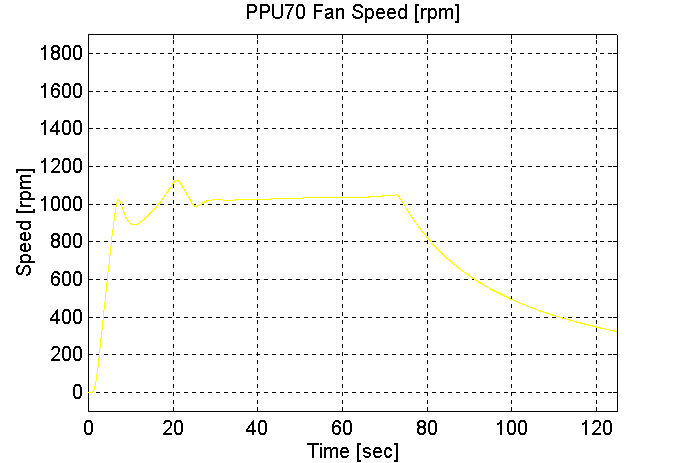
Figure 172. PPU70 Fan Speed, Dual PPU’s, Station 1 to 2, Empty Vehicle (Grade=0)
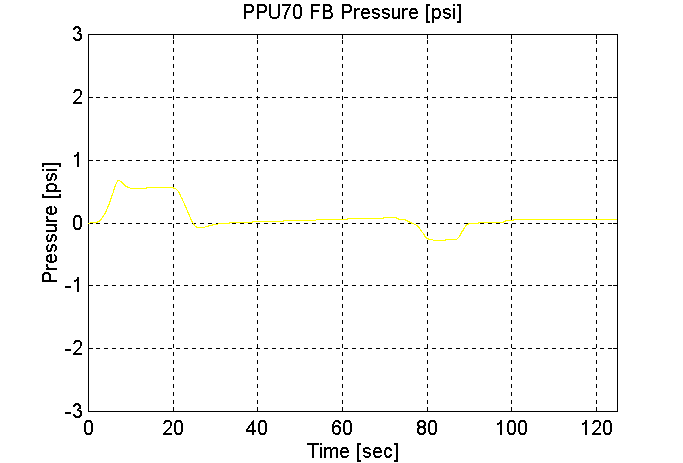
Figure 173. PPU70 FB Pressure, Dual PPU’s, Station 1 to 2, Empty Vehicle (Grade=0)
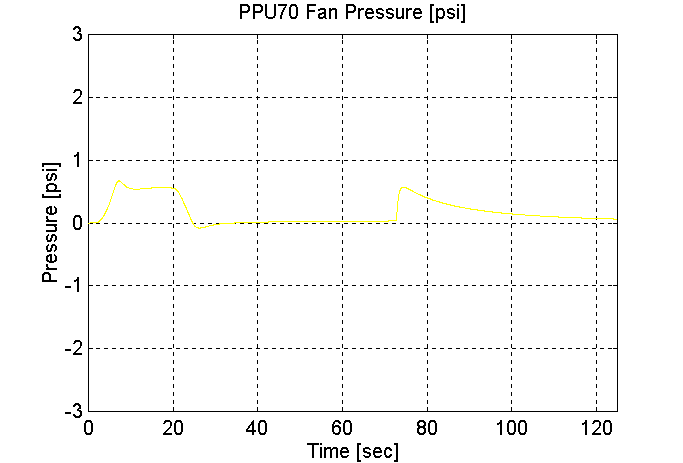
Figure 174. PPU70 Fan Pressure, Dual PPU’s, Station 1 to 2, Empty Vehicle (Grade=0)
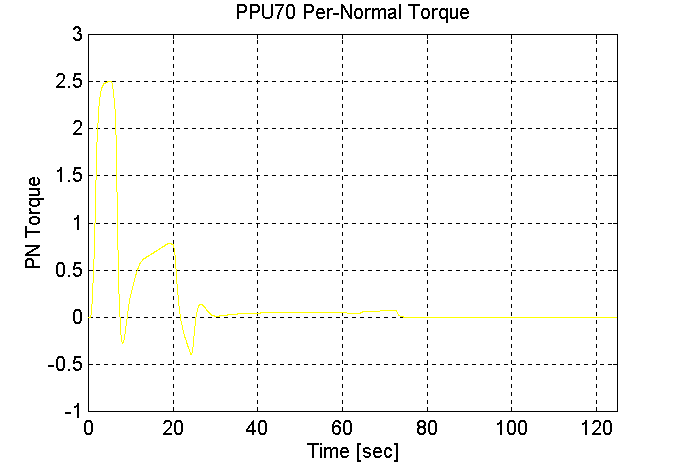
Figure 175. PPU70 PN Torque, Dual PPU’s, Station 1 to 2, Empty Vehicle (Grade=0)
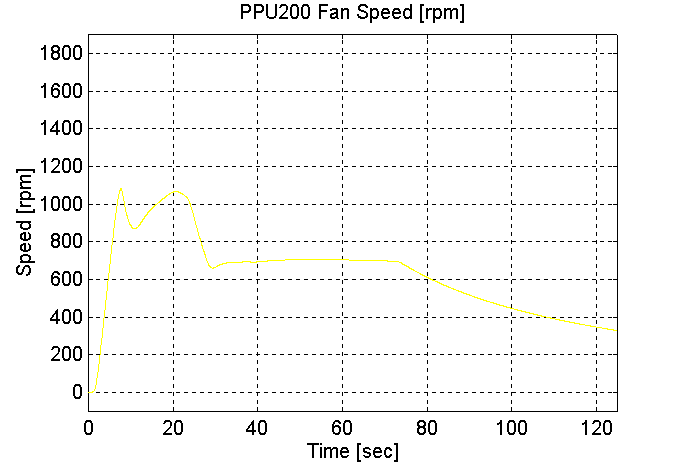
Figure 176. PPU200 Fan Speed, Dual PPU’s, Station 1 to 2, Empty Vehicle (Grade=0)
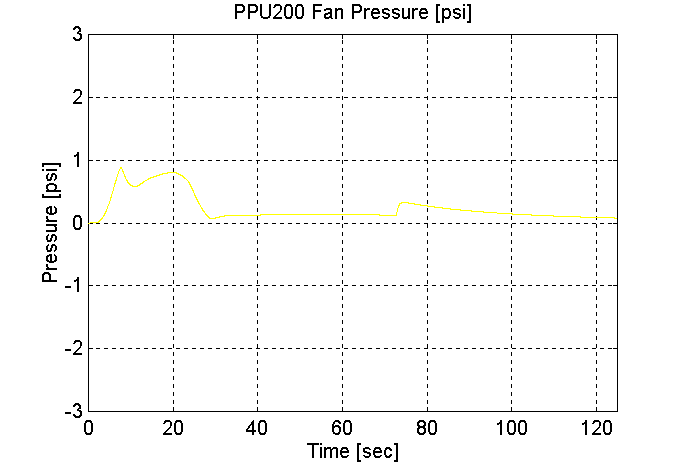
Figure 177. PPU200 Fan Pressure, Dual PPU’s, Station 1 to 2, Empty Vehicle (Grade=0)
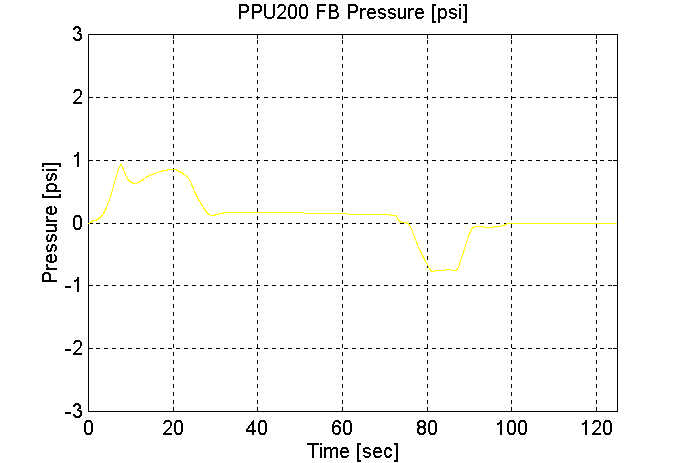
Figure 178. PPU200 FB Pressure, Dual PPU’s, Station 1 to 2, Empty Vehicle (Grade=0)
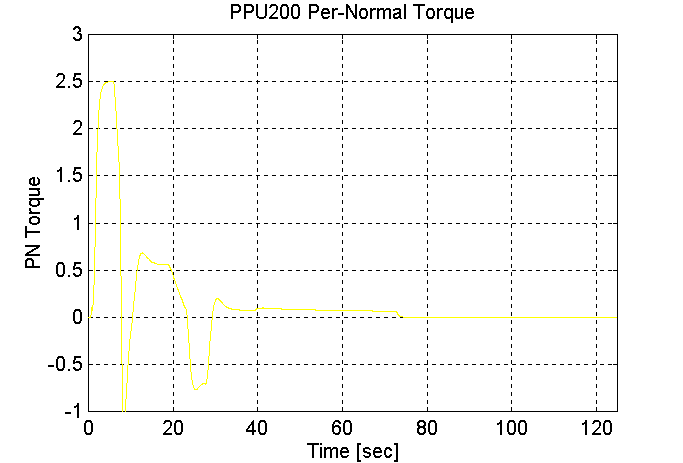
Figure 179. PPU200 PN Torque, Dual PPU’s, Station 1 to 2, Empty Vehicle (Grade=0)
Mid-load Load (Dual PPU’s Grade = 0 Vmax = 50 [kph)
Station 2 to Station 1 (PPU 200 pulling, PPU70 pushing), Mid-load Vehicle, grade = 0.
Grade = 0
With Brakes
Dual PPU’s
PPU70 -> PPU200
MV = 21300 [Kg]
Vmax = = 50 [kph]
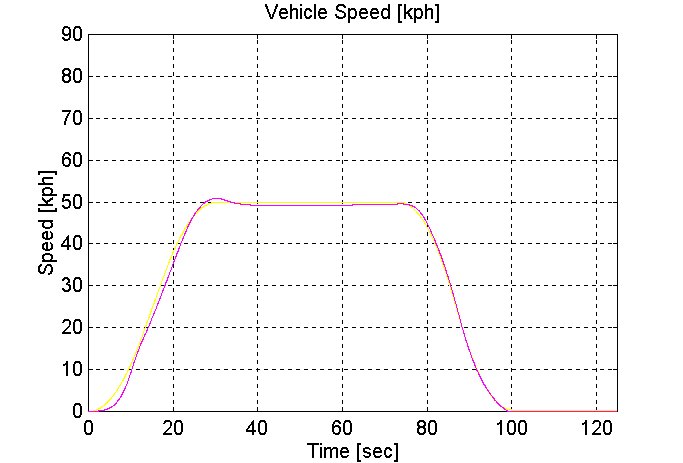
Figure 180. Vehicle Speed, Dual PPU’s, Station 2 to 1, Mid-load Vehicle (Grade=0)
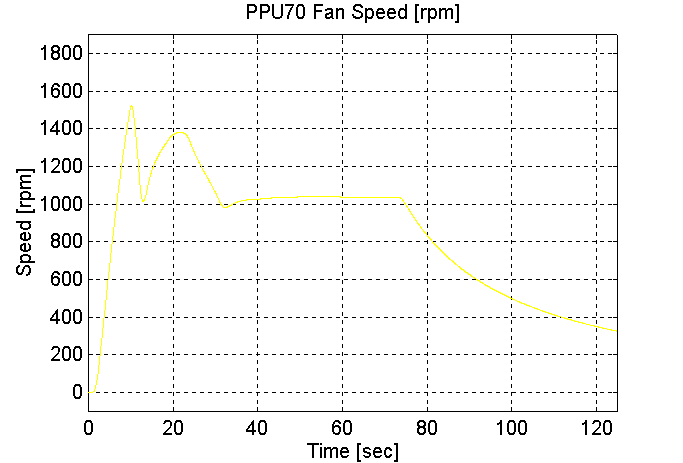
Figure 181. PPU70 Fan Speed, Dual PPU’s, Station 2 to 1, Mid-load Vehicle (Grade=0)
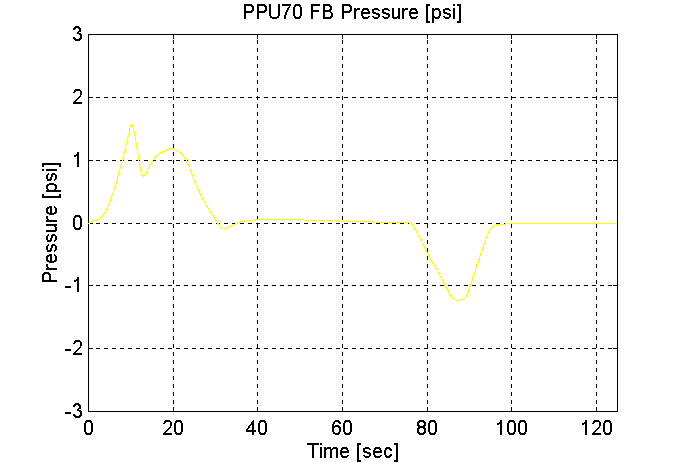
Figure 182. PPU70 FB Pressure, Dual PPU’s, Station 2 to 1, Mid-load Vehicle (Grade=0)
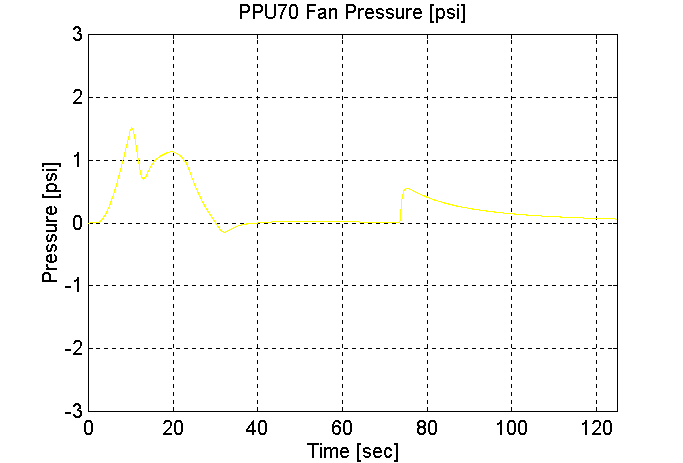
Figure 183. PPU70 Fan Pressure, Dual PPU’s, Station 2 to 1, Mid-load Vehicle (Grade=0)
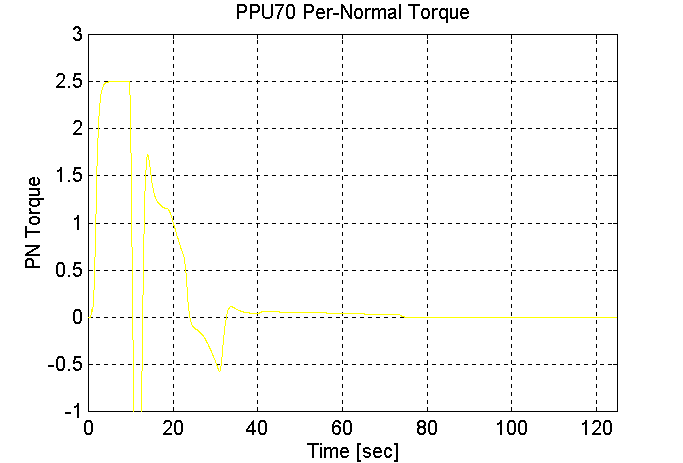
Figure 184. PPU70 PN Torque, Dual PPU’s, Station 2 to 1, Mid-load Vehicle (Grade=0)
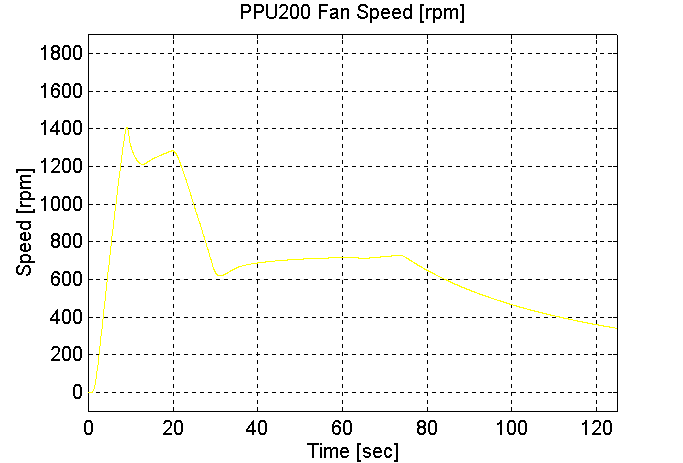
Figure 185. PPU200 Fan Speed, Dual PPU’s, Station 2 to 1, Mid-load Vehicle (Grade=0)
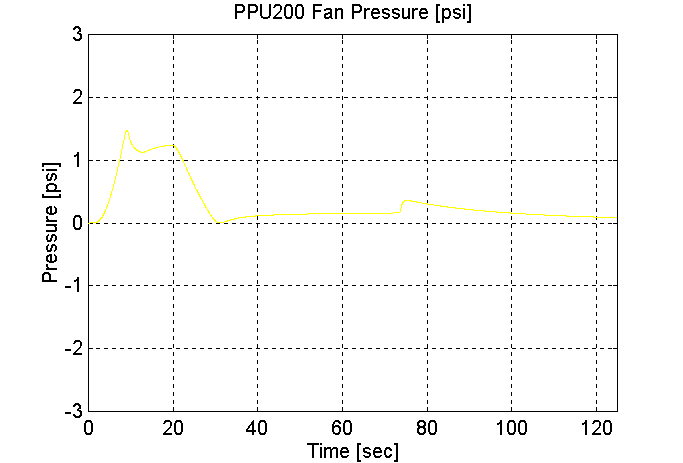
Figure 186. PPU200 Fan Pressure, Dual PPU’s, Station 2 to 1, Mid-load Vehicle (Grade=0)
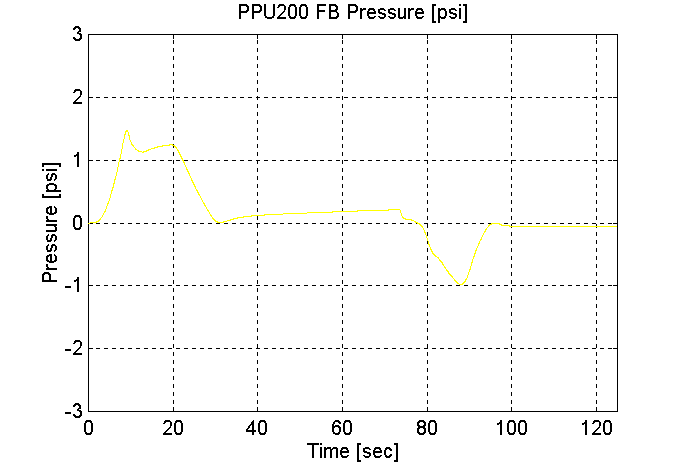
Figure 187. PPU200 FB Pressure, Dual PPU’s, Station 2 to 1, Mid-load Vehicle (Grade=0)
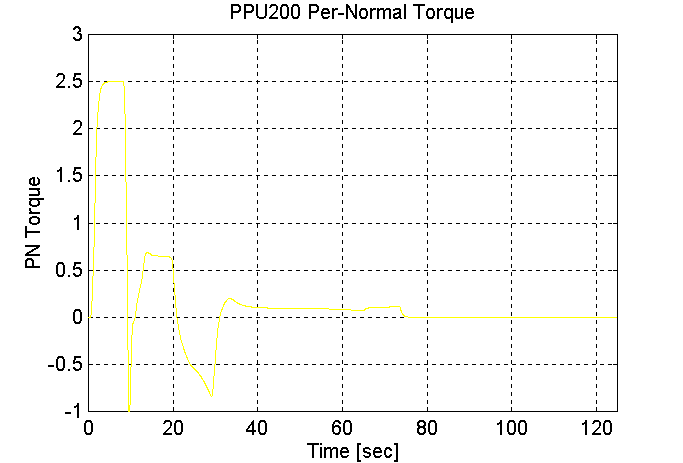
Figure 188. PPU200 PN Torque, Dual PPU’s, Station 2 to 1, Mid-load Vehicle (Grade=0)
Full Load (Dual PPU’s Grade = 0 Vmax = 50 [kph)
Station 1 to Station 2 (PPU 200 pushing, PPU70 pulling), Full Vehicle, grade = 0.
Grade = 0
With Brakes
Dual PPU’s
PPU200 -> PPU70
MV = 30300 [Kg]
Vmax = = 50 [kph]
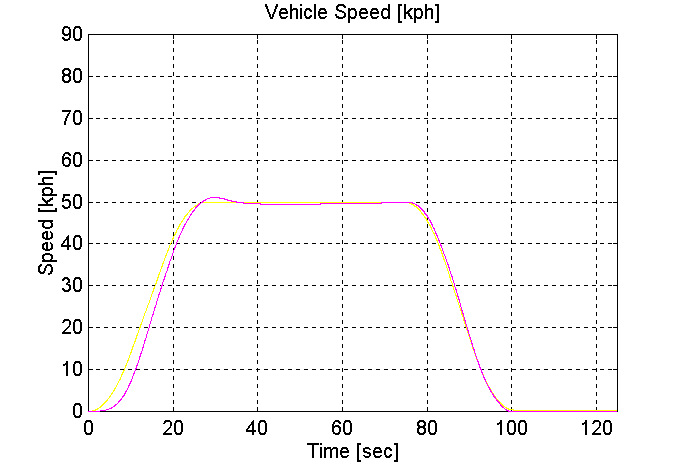
Figure 189. Vehicle Speed, Dual PPU’s, Station 1 to 2, Full Vehicle (Grade=0)
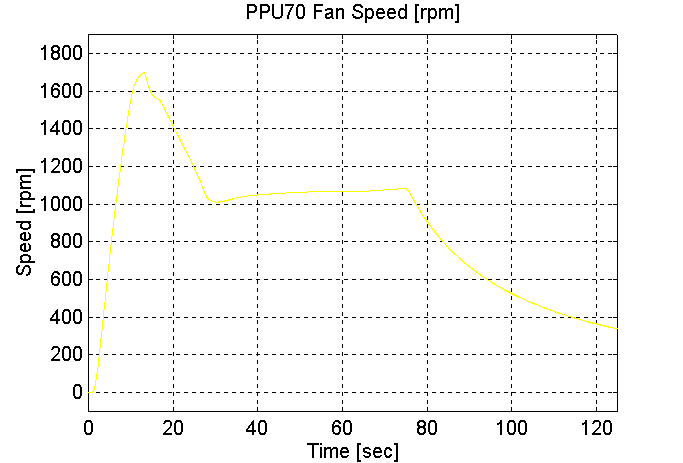
Figure 190. PPU70 Fan Speed, Dual PPU’s, Station 1 to 2, Full Vehicle (Grade=0)
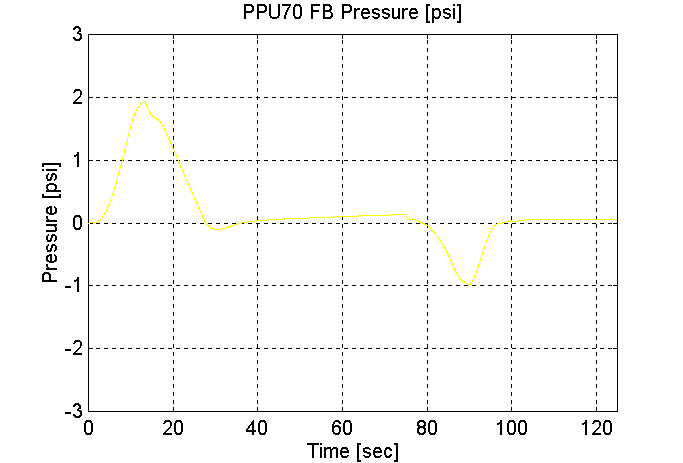
Figure 191. PPU70 FB Pressure, Dual PPU’s, Station 1 to 2, Full Vehicle (Grade=0)
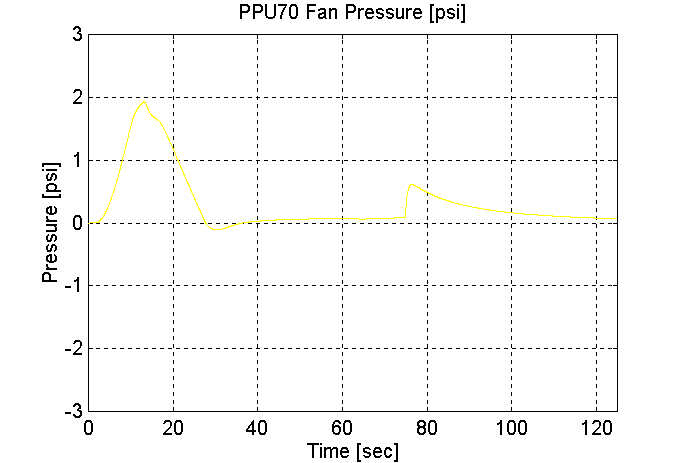
Figure 192. PPU70 Fan Pressure, Dual PPU’s, Station 1 to 2, Full Vehicle (Grade=0)
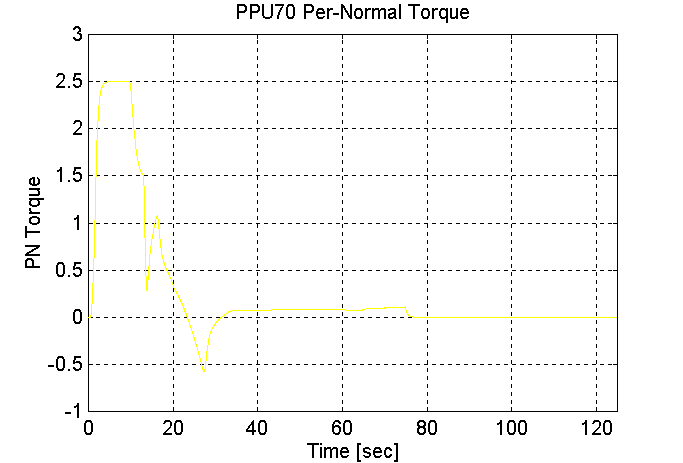
Figure 193. PPU70 PN Torque, Dual PPU’s, Station 1 to 2, Full Vehicle (Grade=0)
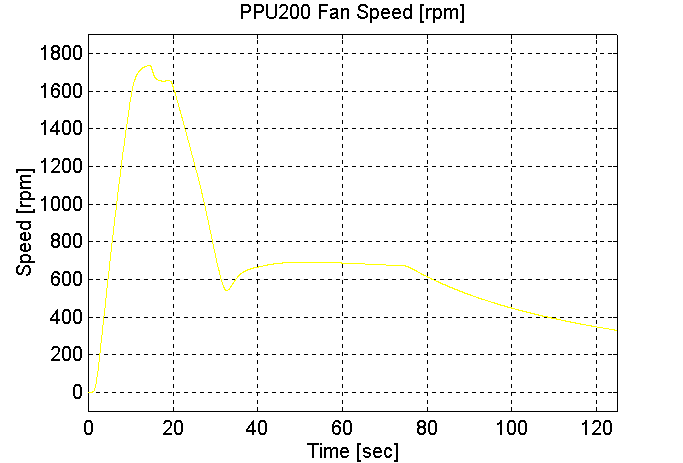
Figure 194. PPU200 Fan Speed, Dual PPU’s, Station 1 to 2, Full Vehicle (Grade=0)
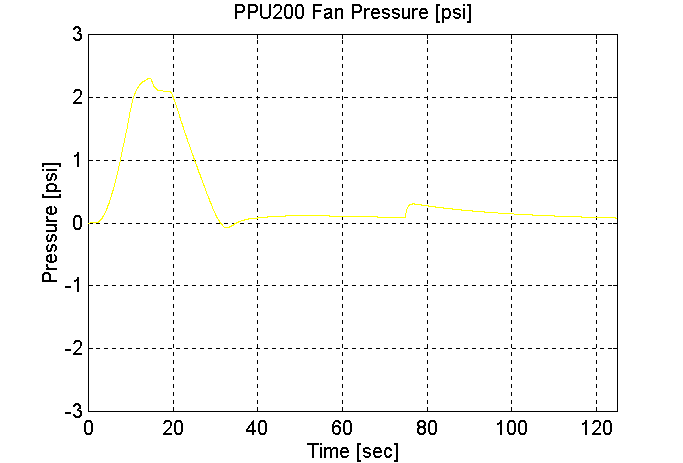
Figure 195. PPU200 Fan Pressure, Dual PPU’s, Station 1 to 2, Full Vehicle (Grade=0)

Figure 196. PPU200 FB Pressure, Dual PPU’s, Station 1 to 2, Full Vehicle (Grade=0)
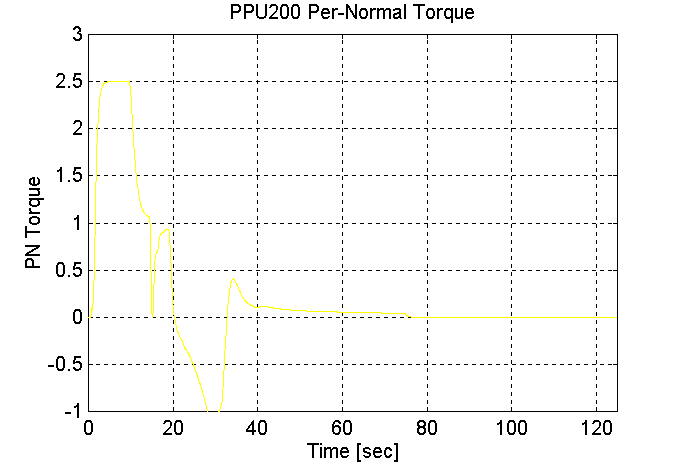
Figure 197. PPU200 PN Torque, Dual PPU’s, Station 1 to 2, Full Vehicle (Grade=0)
Empty Load (Single PPU’s Grade = 8, Vmax = 50 [kph])
Station 1 to Station 2 (PPU 200 pushing), Empty Vehicle, grade = 8.
Grade = 0
With Brakes
Single PPU
PPU200 -> PPU70
MV = 12300 [Kg]
Vmax = = 50 [kph]
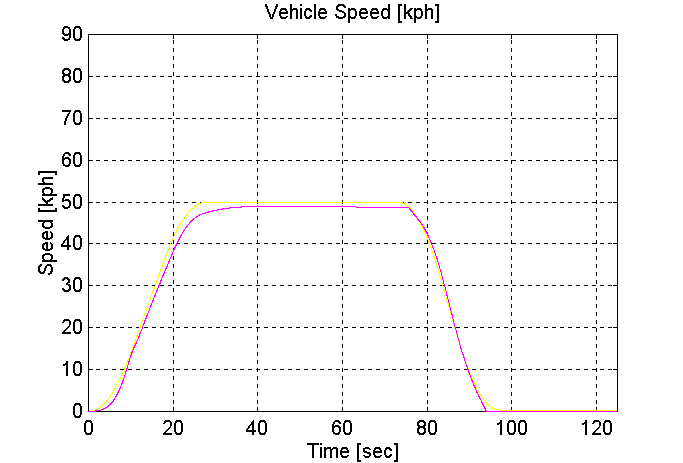
Figure 198. Vehicle Speed, Single PPU, Station 1 to 2, Empty Vehicle (Grade=8)
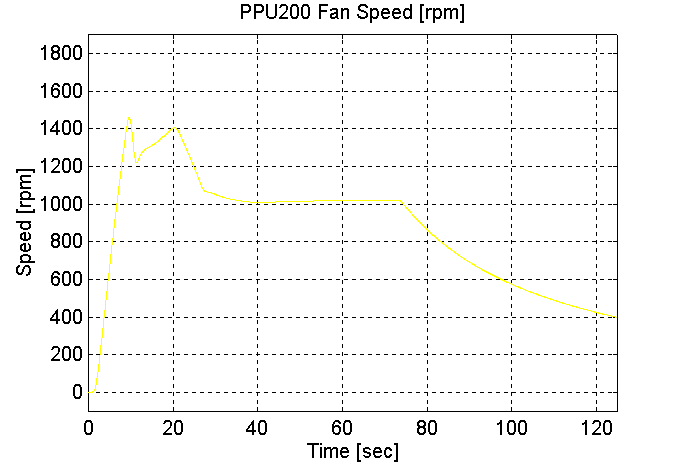
Figure 199. PPU200 Fan Speed, Single PPU, Station 1 to 2, Empty Vehicle (Grade=8)
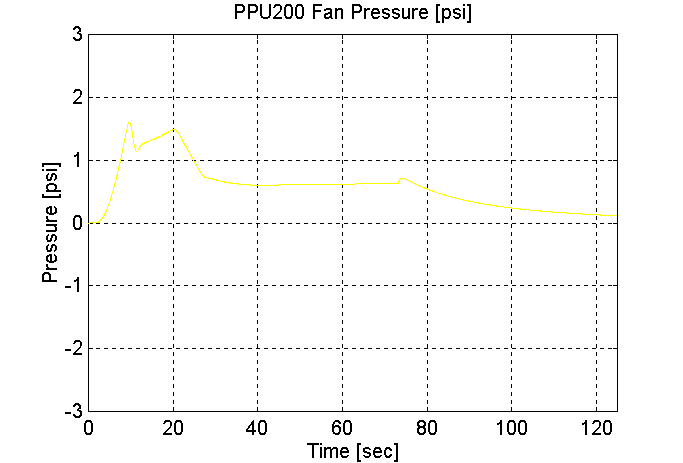
Figure 200. PPU200 FB Pressure, Single PPU, Station 1 to 2, Empty Vehicle (Grade=8)
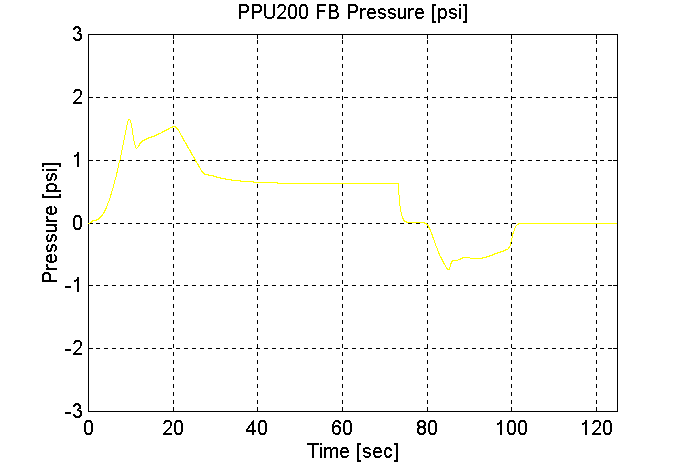
Figure 201. PPU200 Fan Pressure, Single PPU, Station 1 to 2, Empty Vehicle (Grade=8)
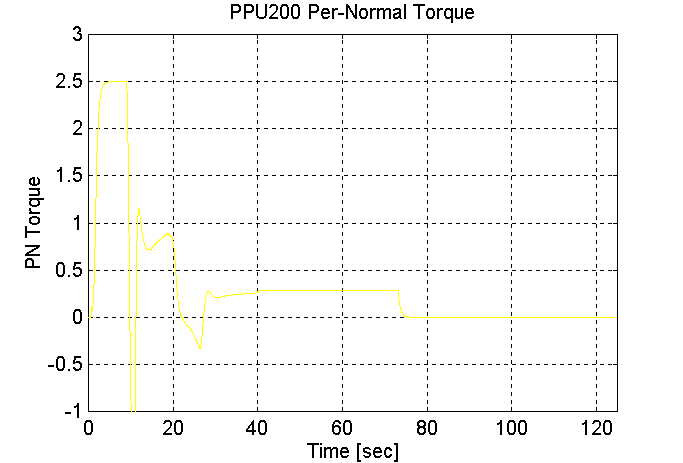
Figure 202. PPU200 PN Torque, Single PPU, Station 1 to 2, Empty Vehicle (Grade=8)
Mid-load Load (Dual PPU’s Grade = 8 Vmax = 50 [kph)
Station 1 to Station 2 (PPU 200 pulling, PPU70 pushing), Mid-load Vehicle, grade = 8.
Grade = 0
With Brakes
Dual PPU’s
PPU200 -> PPU70
MV = 21300 [Kg]
Vmax = = 50 [kph]
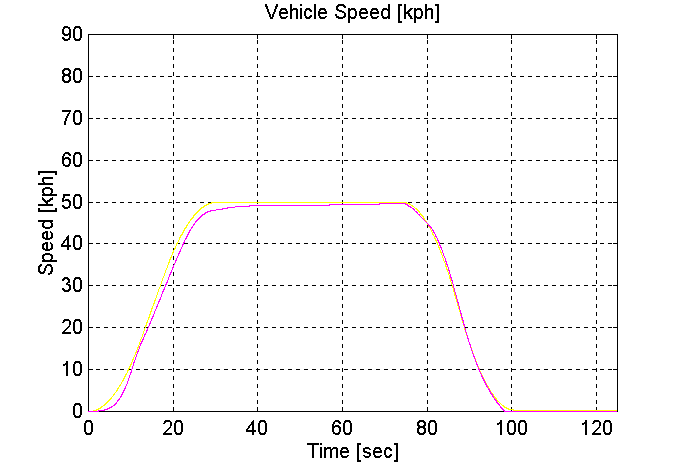
Figure 203. Vehicle Speed, Dual PPU’s, Station 1 to 2, Mid-load Vehicle (Grade=8)
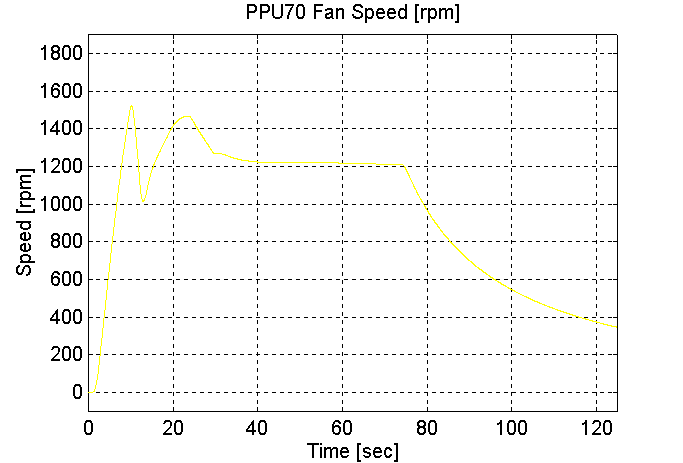
Figure 204. PPU70 Fan Speed, Dual PPU’s, Station 1 to 2, Mid-load Vehicle (Grade=8)
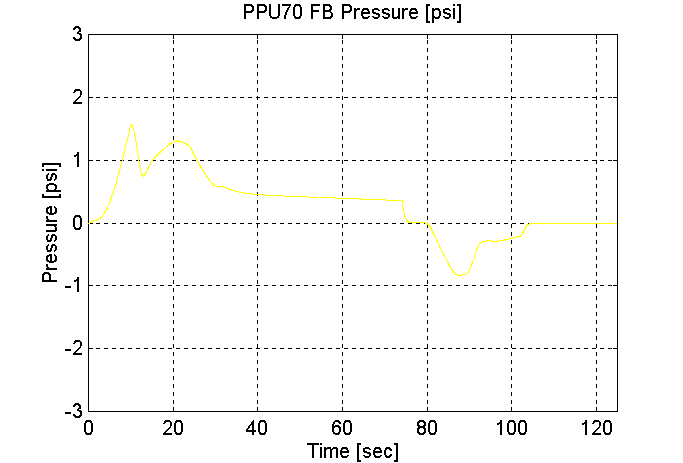
Figure 205. PPU70 FB Pressure, Dual PPU’s, Station 1 to 2, Mid-load Vehicle (Grade=8)
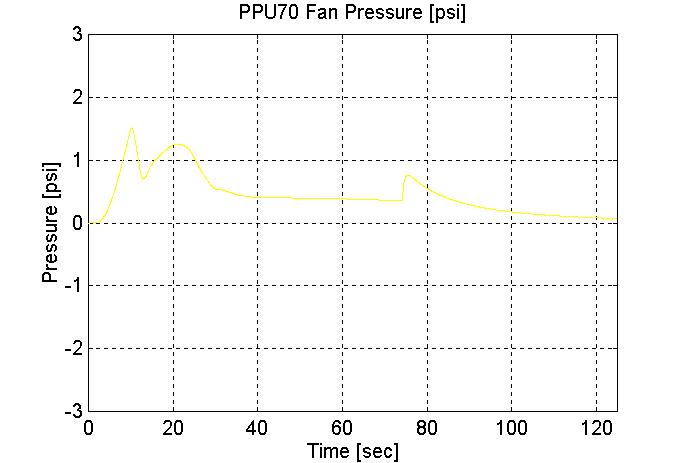
Figure 206. PPU70 Fan Pressure, Dual PPU’s, Station 1 to 2, Mid-load Vehicle (Grade=8)
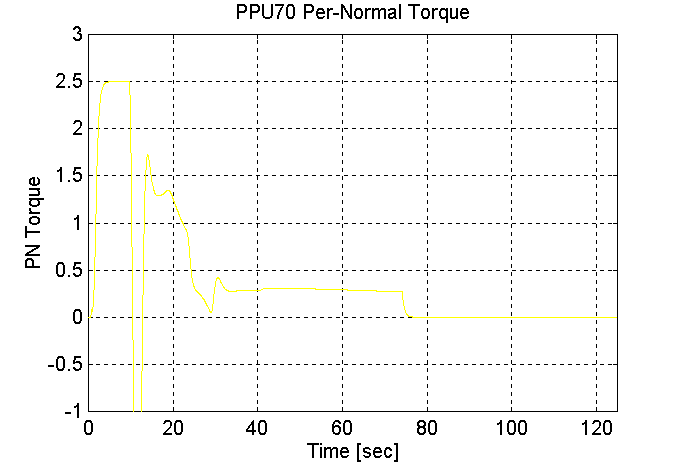
Figure 207. PPU70 PN Torque, Dual PPU’s, Station 1 to 2, Mid-load Vehicle (Grade=8)
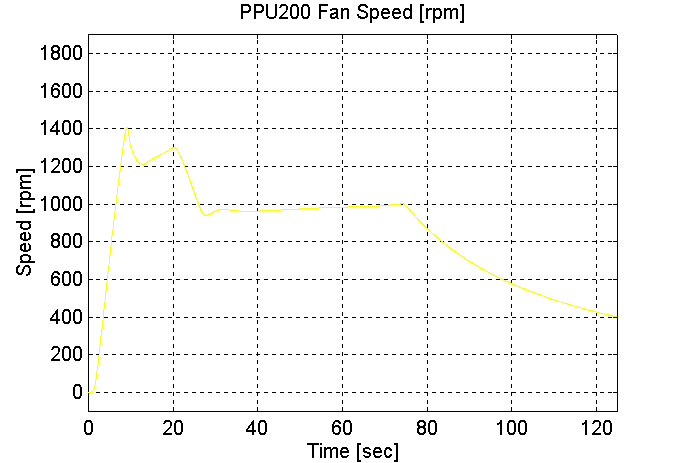
Figure 208. PPU200 Fan Speed, Dual PPU’s, Station 1 to 2, Mid-load Vehicle (Grade=8)
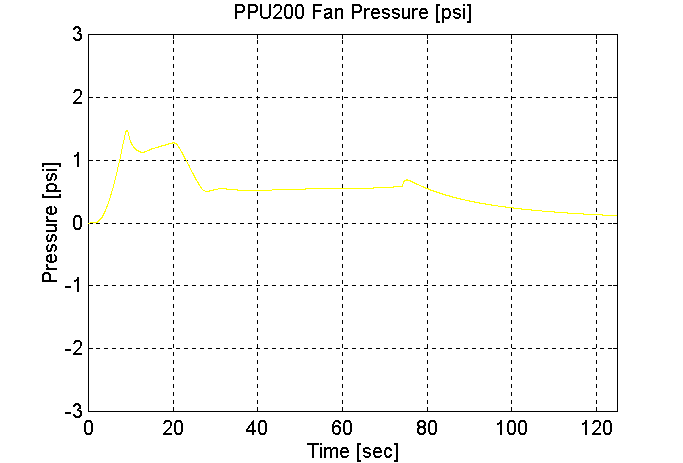
Figure 209. PPU200 Fan Pressure, Dual PPU’s, Station 1 to 2, Mid-load Vehicle (Grade=8)
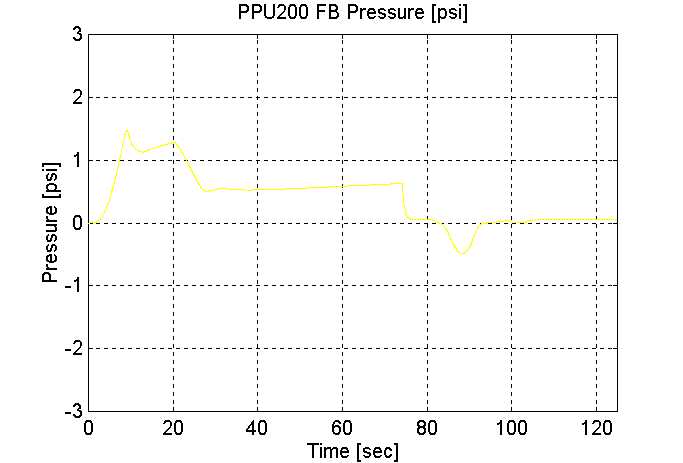
Figure 210. PPU200 FB Pressure, Dual PPU’s, Station 1 to 2, Mid-load Vehicle (Grade=8)
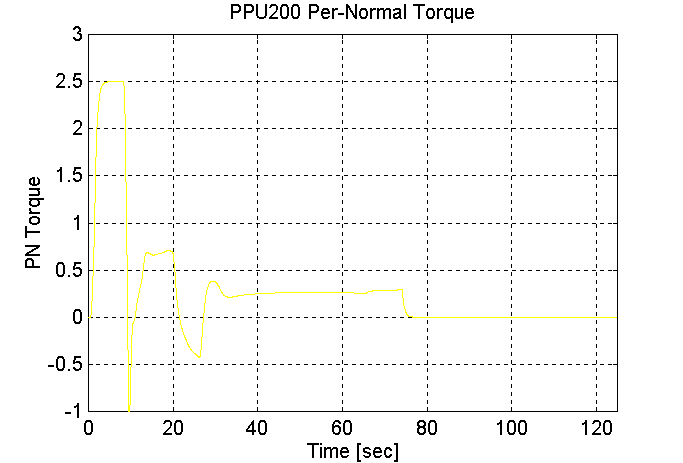
Figure 211. PPU200 PN Torque, Dual PPU’s, Station 1 to 2, Mid-load Vehicle (Grade=8)
Full Load (Dual PPU’s Grade = 8 Vmax = 50 [kph)
Station 2 to Station 1 (PPU 200 pulling, PPU70 pushing), Full Vehicle, grade = 8.
Grade = 8
With Brakes
Dual PPU’s
PPU70 -> PPU200
MV = 30300 [Kg]
Vmax = = 50 [kph]
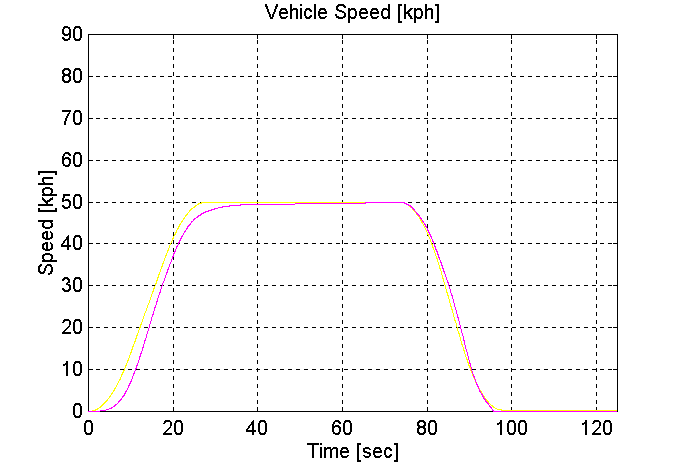
Figure 212. Vehicle Speed, Dual PPU’s, Station 2 to 1, Full Vehicle (Grade=8)
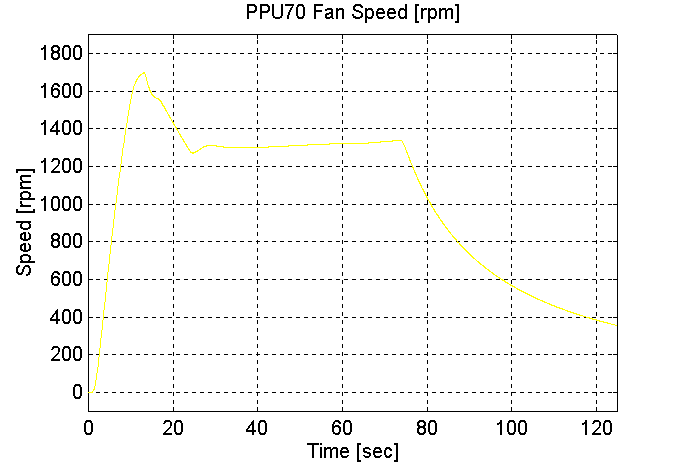
Figure 213. PPU70 Fan Speed, Dual PPU’s, Station 2 to 1, Full Vehicle (Grade=8)
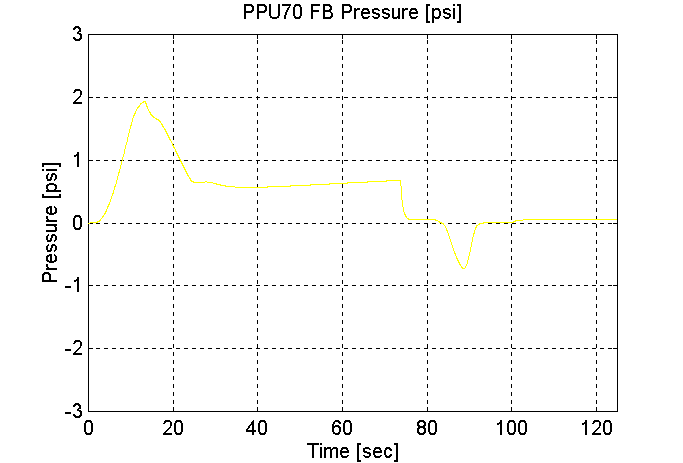
Figure 214. PPU70 FB Pressure, Dual PPU’s, Station 2 to 1, Full Vehicle (Grade=8)
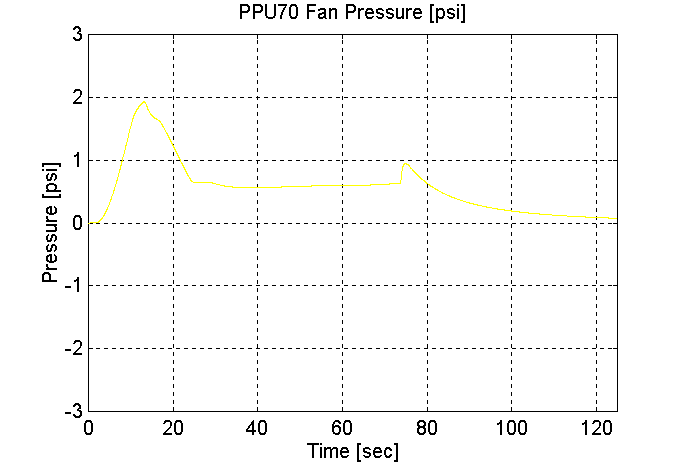
Figure 215. PPU70 Fan Pressure, Dual PPU’s, Station 2 to 1, Full Vehicle (Grade=8)

Figure 216. PPU70 PN Torque, Dual PPU’s, Station 2 to 1, Full Vehicle (Grade=8)
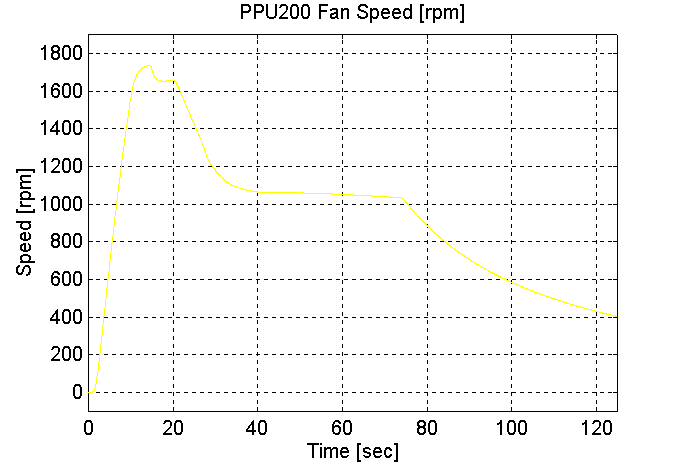
Figure 217. PPU200 Fan Speed, Dual PPU’s, Station 2 to 1, Full Vehicle (Grade=8)
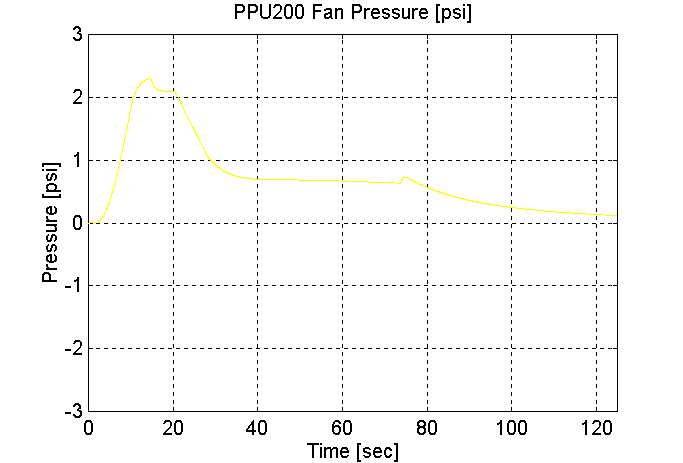
Figure 218. PPU200 Fan Pressure, Dual PPU’s, Station 2 to 1, Full Vehicle (Grade=8)
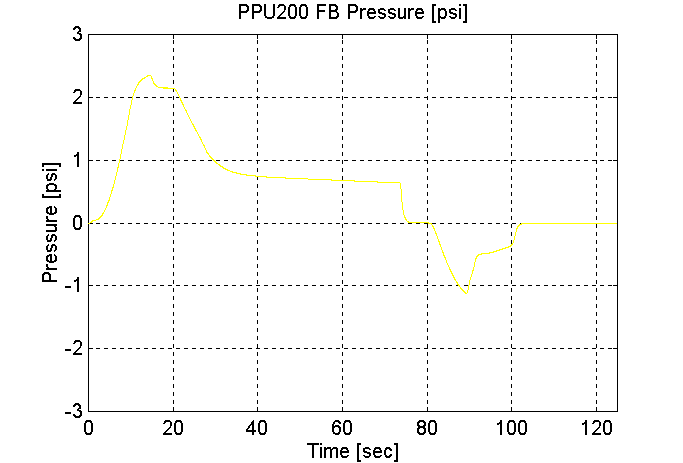
Figure 219. PPU200 FB Pressure, Dual PPU’s, Station 2 to 1, Full Vehicle (Grade=8)
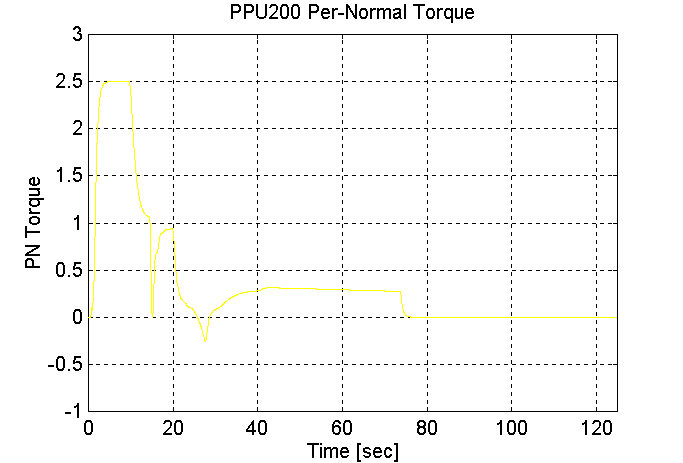
Figure 220. PPU200 PN Torque, Dual PPU’s, Station 2 to 1, Full Vehicle (Grade=8)
Empty Load (Single PPU’s Grade = 0 Vmax = 30 [kph])
Station 2 to Station 1 (PPU 200 pulling), Empty Vehicle, grade = 0.
Grade = 0
With Brakes
Single PPU
PPU70 -> PPU200
MV = 12300 [Kg]
Vmax = = 30 [kph]
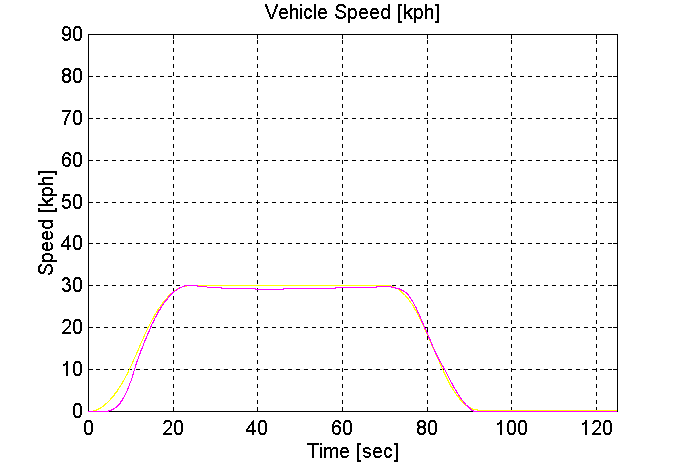
Figure 221. Vehicle Speed, Single PPU, Station 2 to 1, Empty Vehicle (Grade=0)
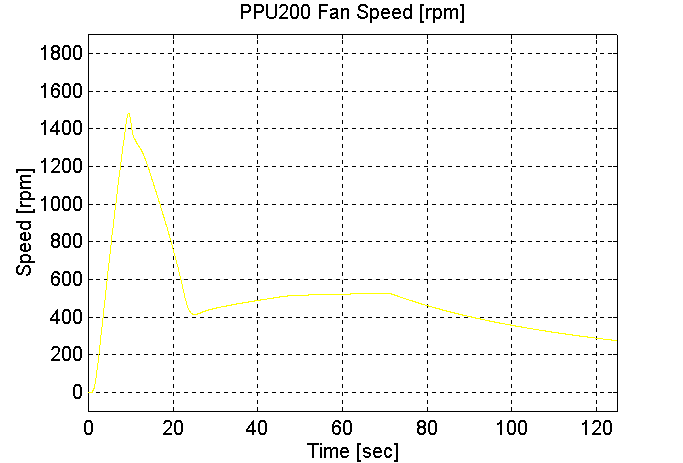
Figure 222. PPU200 Fan Speed, Single PPU, Station 2 to 1, Empty Vehicle (Grade=0)
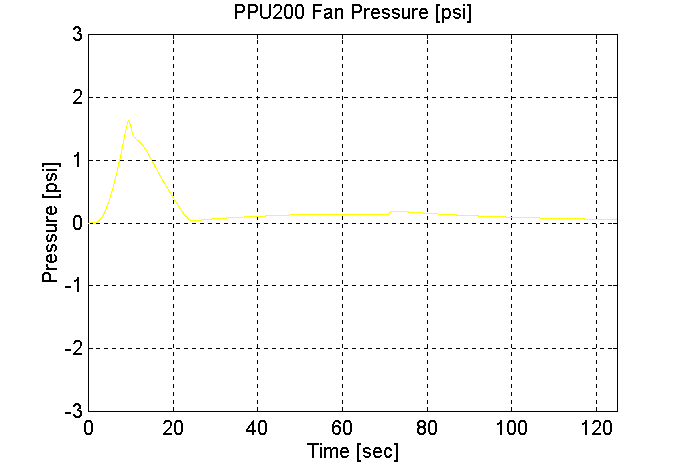
Figure 223. PPU200 FB Pressure, Single PPU, Station 2 to 1, Empty Vehicle (Grade=0)
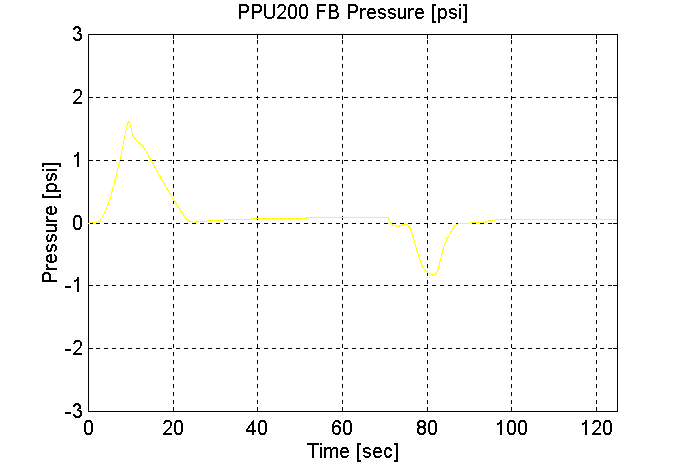
Figure 224. PPU200 Fan Pressure, Single PPU, Station 2 to 1, Empty Vehicle (Grade=0)
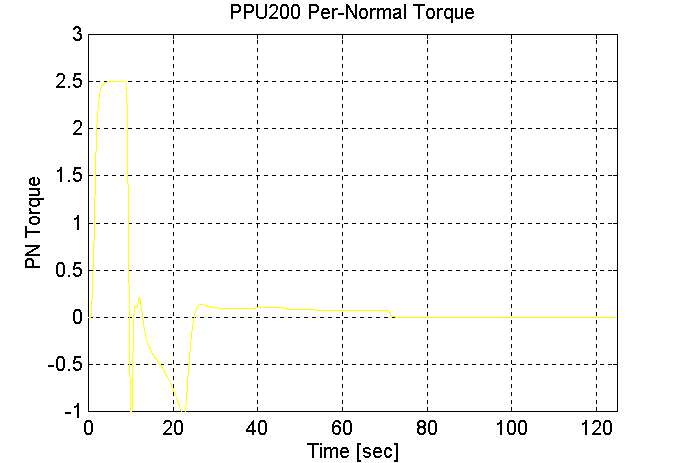
Figure 225. PPU200 PN Torque, Single PPU, Station 2 to 1, Empty Vehicle (Grade=0)
Mid Load (Single PPU’s Grade = 0 Vmax = 30 [kph])
Station 1 to Station 2 (PPU 200 pushing), Mid-load Vehicle, grade = 0.
Grade = 0
With Brakes
Single PPU
PPU200 -> PPU70
MV = 21300 [Kg]
Vmax = = 30 [kph]
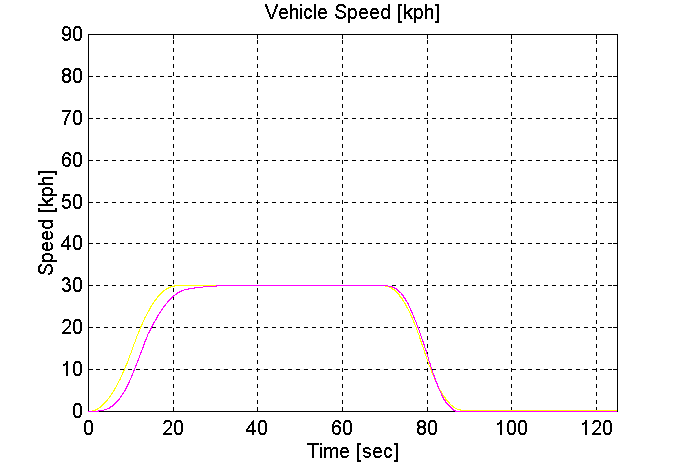
Figure 226. Vehicle Speed, Single PPU, Station 1 to 2, Mid-load Vehicle (Grade=0)
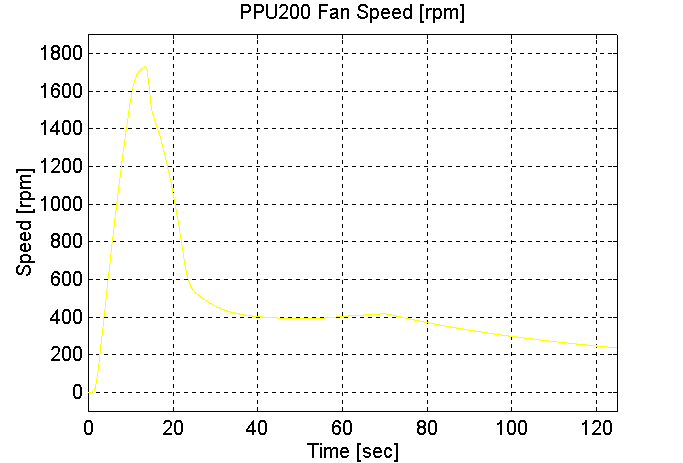
Figure 227. PPU200 Fan Speed, Single PPU, Station 1 to 2, Mid-load Vehicle (Grade=0)
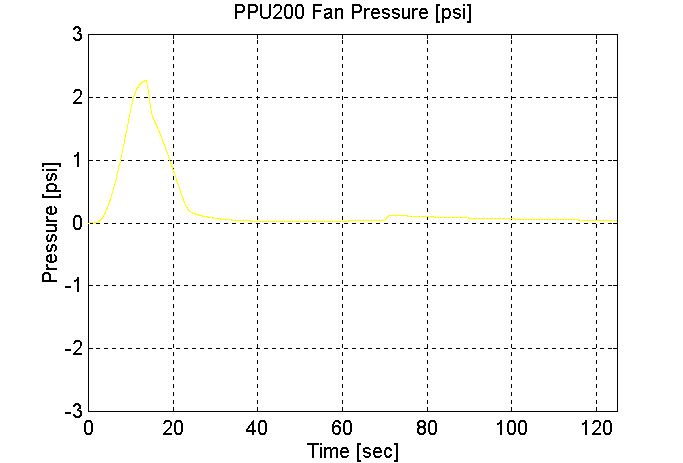
Figure 228. PPU200 FB Pressure, Single PPU, Station 1 to 2, Mid-load Vehicle (Grade=0)
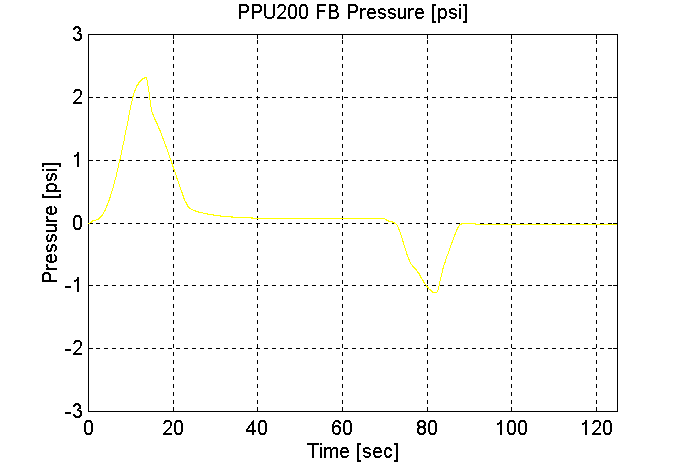
Figure 229. PPU200 Fan Pressure, Single PPU, Station 1 to 2, Mid-load Vehicle (Grade=0)
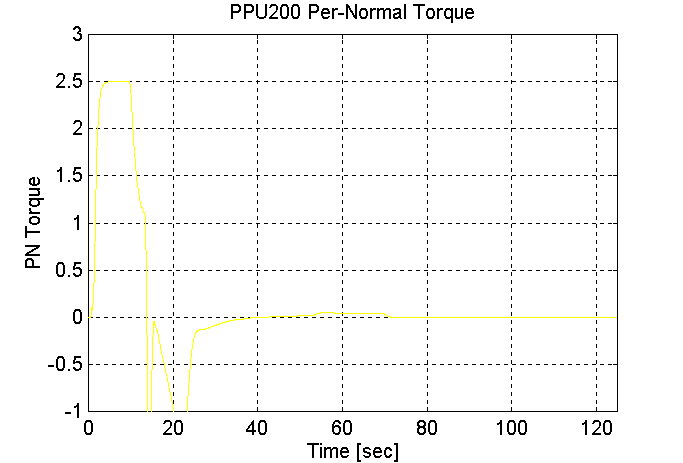
Figure 230. PPU200 PN Torque, Single PPU, Station 1 to 2, Mid-load Vehicle (Grade=0)
Full Load (Single PPU’s Grade = 0 Vmax = 30 [kph])
Station 2 to Station 1 (PPU 200 pulling), Full-load Vehicle, grade = 0.
Grade = 0
With Brakes
Single PPU
PPU70 -> PPU200
MV = 30300 [Kg]
Vmax = = 30 [kph]
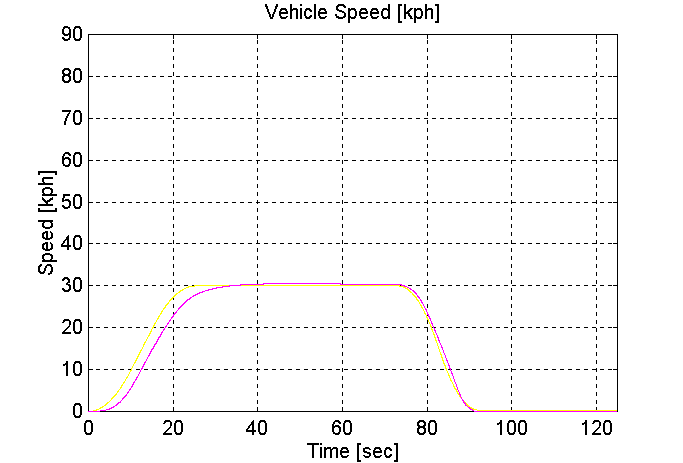
Figure 231. Vehicle Speed, Single PPU, Station 2 to 1, Full-load Vehicle (Grade=0)
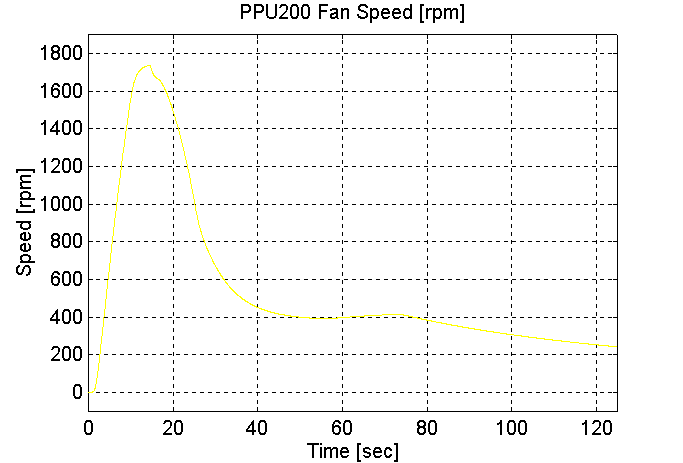
Figure 232. PPU200 Fan Speed, Single PPU, Station 2 to 1, Full-load Vehicle (Grade=0)
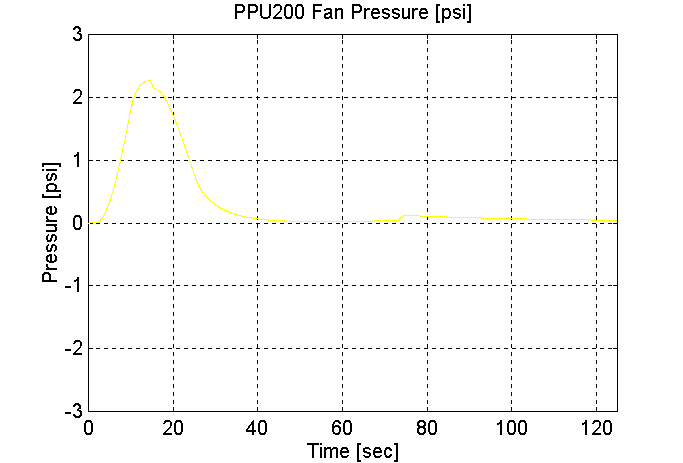
Figure 233. PPU200 FB Pressure, Single PPU, Station 2 to 1, Full-load Vehicle (Grade=0)
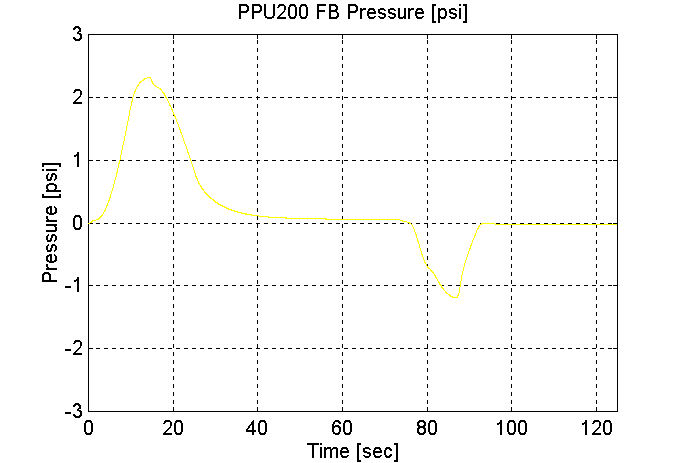
Figure 234. PPU200 Fan Pressure, Single PPU, Station 2 to 1, Full-load Vehicle (Grade=0)
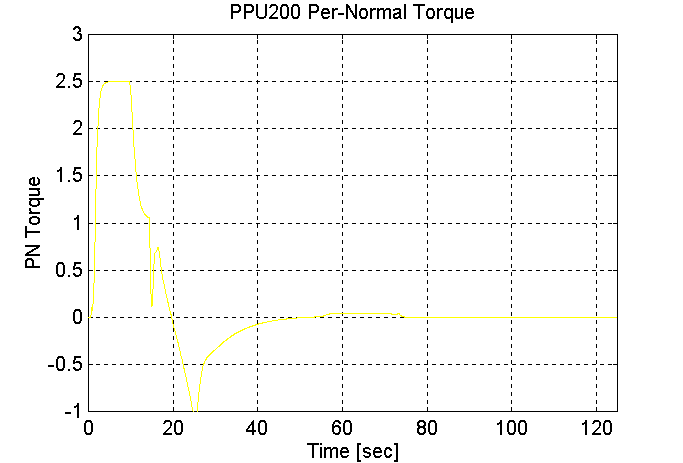
Figure 235. PPU200 PN Torque, Single PPU, Station 2 to 1, Full-load Vehicle (Grade=0)
Empty Load (Dual PPU’s Grade = 0 Vmax = 30 [kph])
Station 1 to Station 2 (PPU 200 pushing, PPU70 pulling), empty Vehicle, grade = 0.
Grade = 0
With Brakes
Dual PPU’s
PPU200 -> PPU70
MV = 12300 [Kg]
Vmax = = 30 [kph]
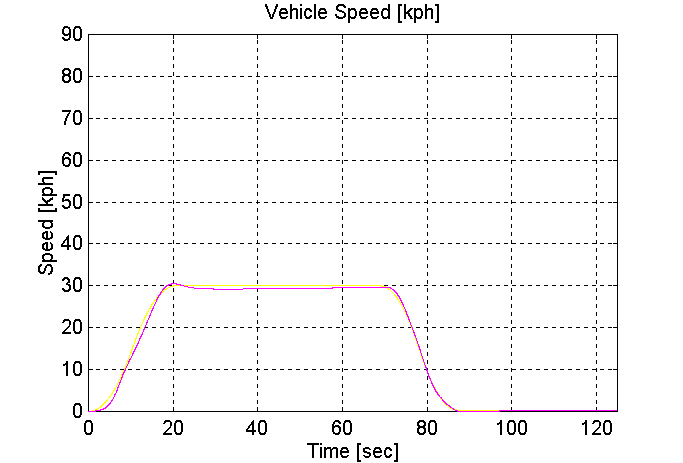
Figure 236. Vehicle Speed, Dual PPU’s, Station 1 to 2, Empty Vehicle (Grade=0)
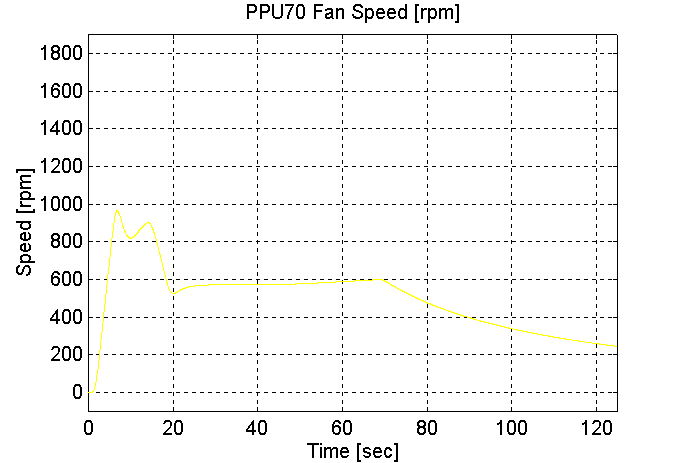
Figure 237. PPU70 Fan Speed, Dual PPU’s, Station 1 to 2, Empty Vehicle (Grade=0)
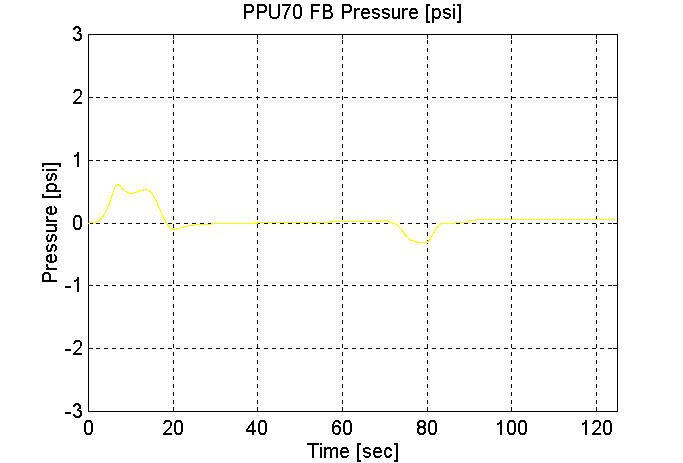
Figure 238. PPU70 FB Pressure, Dual PPU’s, Station 1 to 2, Empty Vehicle (Grade=0)
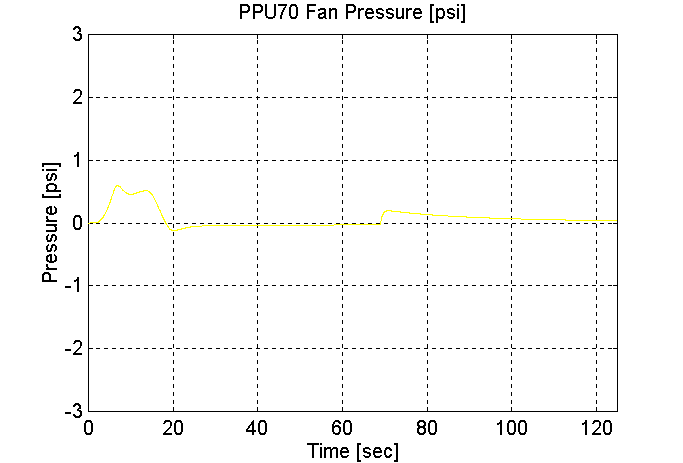
Figure 239. PPU70 Fan Pressure, Dual PPU’s, Station 1 to 2, Empty Vehicle (Grade=0)
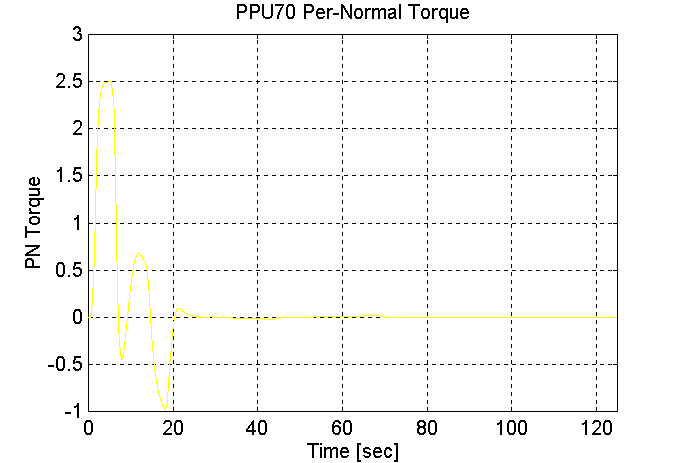
Figure 240. PPU70 PN Torque, Dual PPU’s, Station 1 to 2, Empty Vehicle (Grade=0)
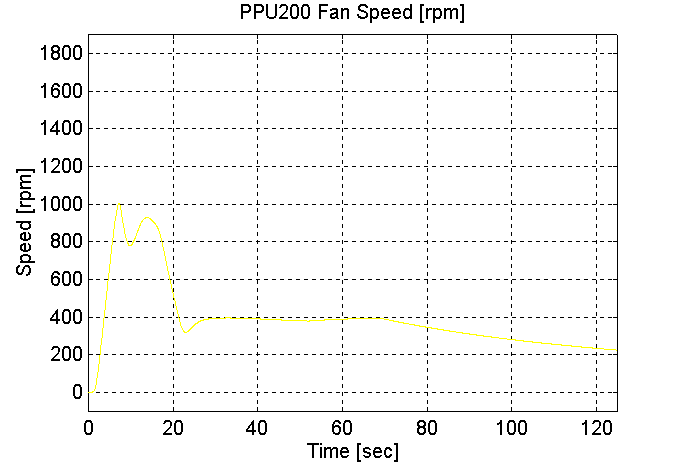
Figure 241. PPU200 Fan Speed, Dual PPU’s, Station 1 to 2, Empty Vehicle (Grade=0)
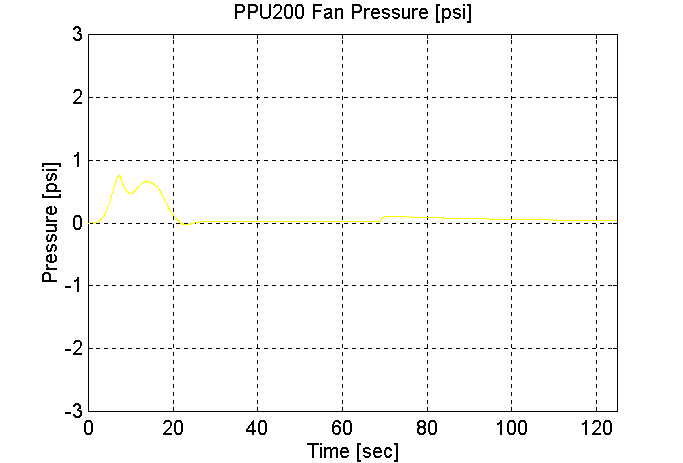
Figure 242. PPU200 Fan Pressure, Dual PPU’s, Station 1 to 2, Empty Vehicle (Grade=0)
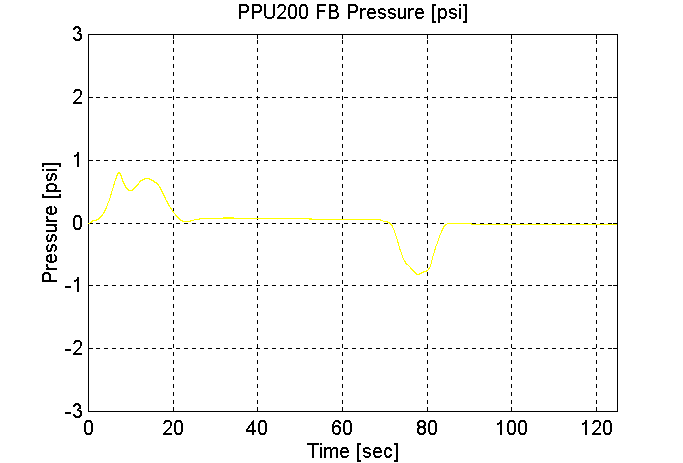
Figure 243. PPU200 FB Pressure, Dual PPU’s, Station 1 to 2, Empty Vehicle (Grade=0)
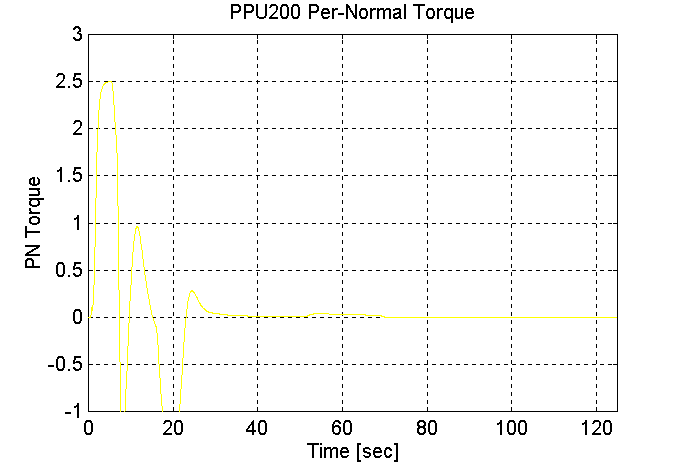
Figure 244. PPU200 PN Torque, Dual PPU’s, Station 1 to 2, Empty Vehicle (Grade=0)
Mid-load Load (Dual PPU’s Grade = 0 Vmax = 30 [kph])
Station 2 to Station 1 (PPU 200 pulling, PPU70 pushing), Mid-load Vehicle, grade = 0.
Grade = 0
With Brakes
Dual PPU’s
PPU70 -> PPU200
MV = 21300 [Kg]
Vmax = = 30 [kph]
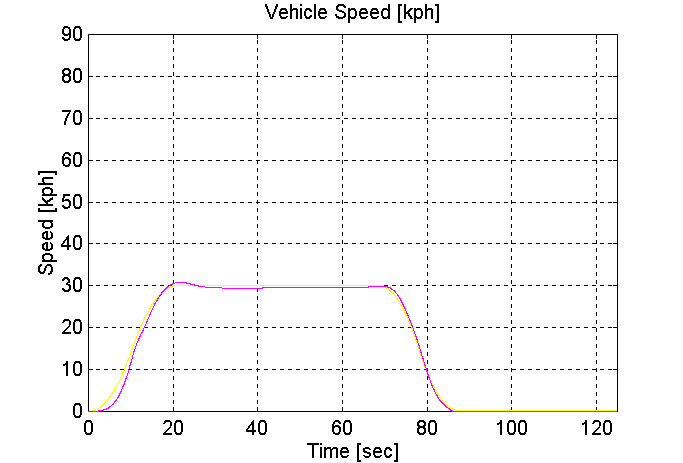
Figure 245. Vehicle Speed, Dual PPU’s, Station 2 to 1, Mid-load Vehicle (Grade=0)
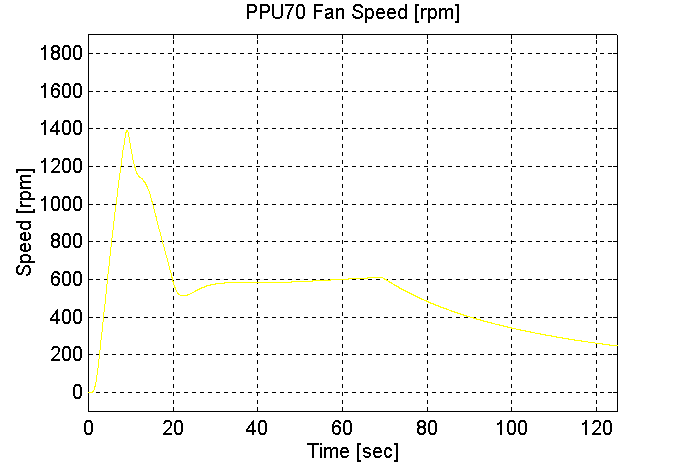
Figure 246. PPU70 Fan Speed, Dual PPU’s, Station 2 to 1, Mid-load Vehicle (Grade=0)
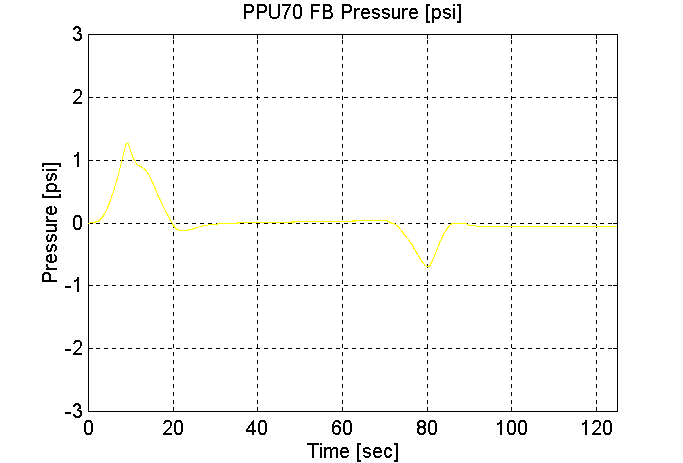
Figure 247. PPU70 FB Pressure, Dual PPU’s, Station 2 to 1, Mid-load Vehicle (Grade=0)
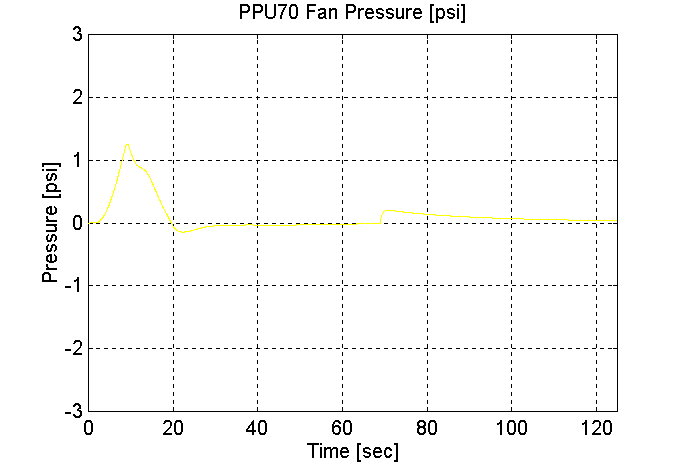
Figure 248. PPU70 Fan Pressure, Dual PPU’s, Station 2 to 1, Mid-load Vehicle (Grade=0)
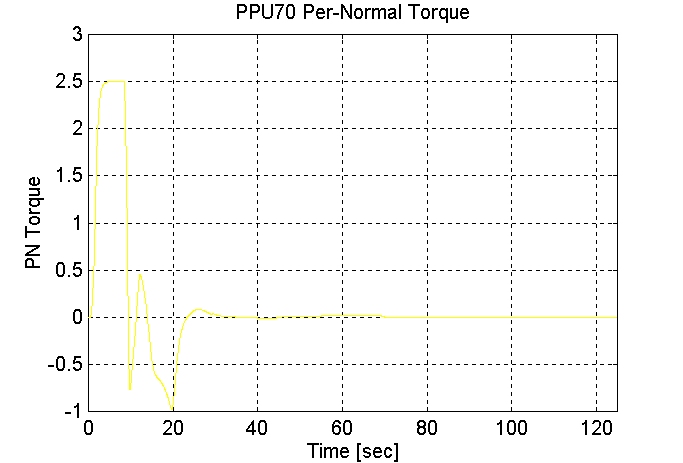
Figure 249. PPU70 PN Torque, Dual PPU’s, Station 2 to 1, Mid-load Vehicle (Grade=0)
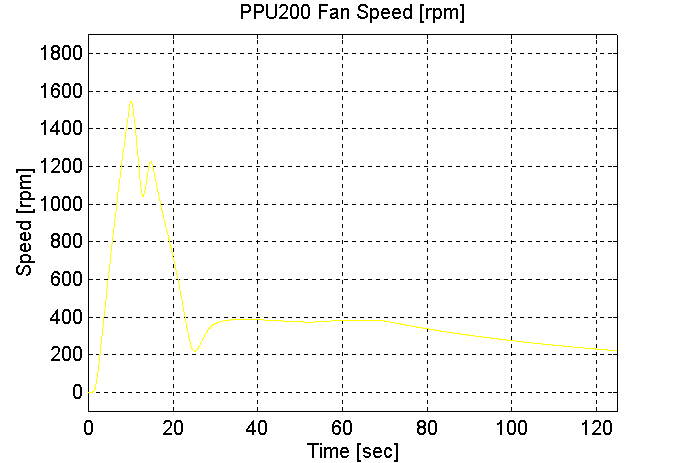
Figure 250. PPU200 Fan Speed, Dual PPU’s, Station 2 to 1, Mid-load Vehicle (Grade=0)
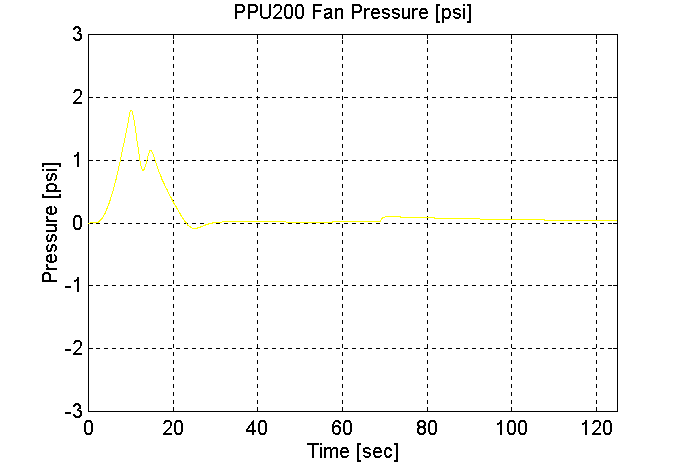
Figure 251. PPU200 Fan Pressure, Dual PPU’s, Station 2 to 1, Mid-load Vehicle (Grade=0)
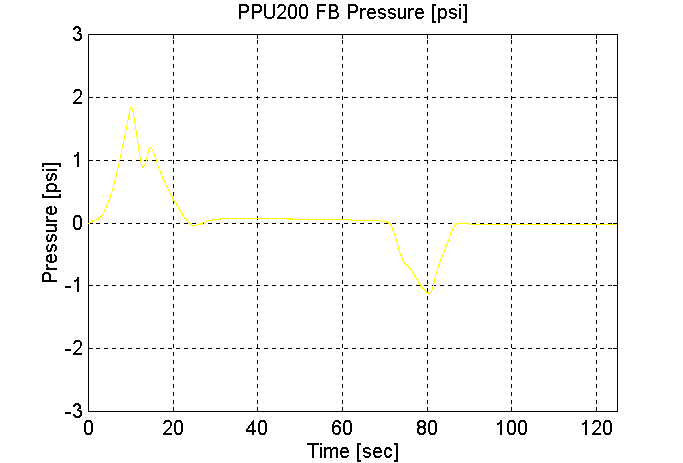
Figure 252. PPU200 FB Pressure, Dual PPU’s, Station 2 to 1, Mid-load Vehicle (Grade=0)
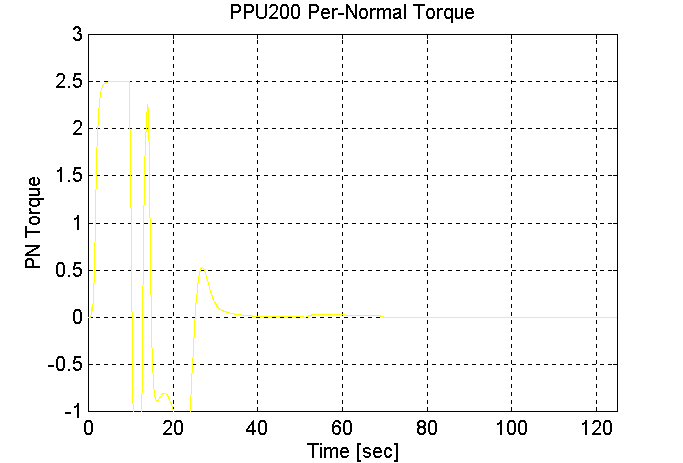
Figure 253. PPU200 PN Torque, Dual PPU’s, Station 2 to 1, Mid-load Vehicle (Grade=0)
Full Load (Dual PPU’s Grade = 0 Vmax = 30 [kph])
Station 1 to Station 2 (PPU 200 pushing, PPU70 pulling), Full Vehicle, grade = 0.
Grade = 0
With Brakes
Dual PPU’s
PPU200 -> PPU70
MV = 30300 [Kg]
Vmax = = 30 [kph]
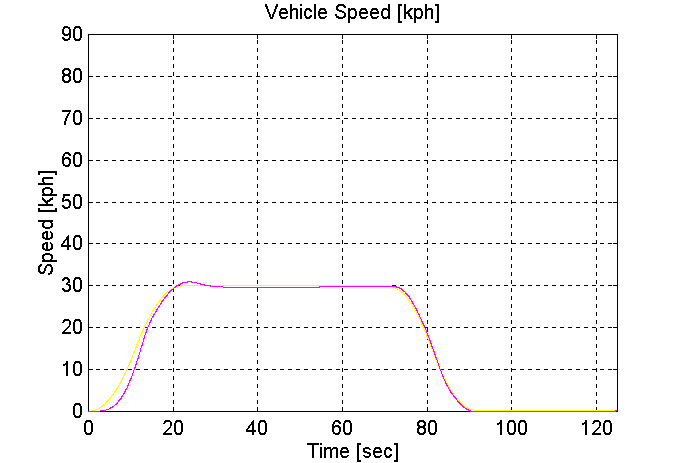
Figure 254. Vehicle Speed, Dual PPU’s, Station 1 to 2, Full Vehicle (Grade=0)
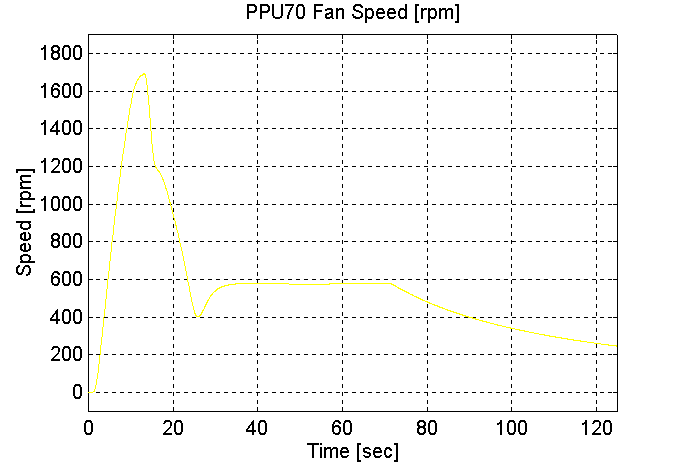
Figure 255. PPU70 Fan Speed, Dual PPU’s, Station 1 to 2, Full Vehicle (Grade=0)
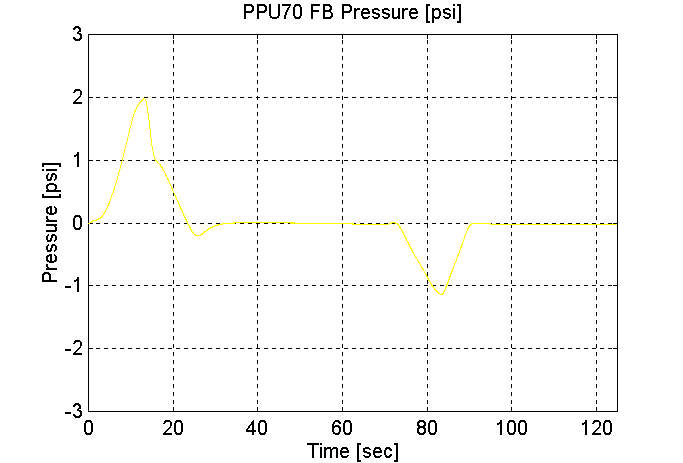
Figure 256. PPU70 FB Pressure, Dual PPU’s, Station 1 to 2, Full Vehicle (Grade=0)
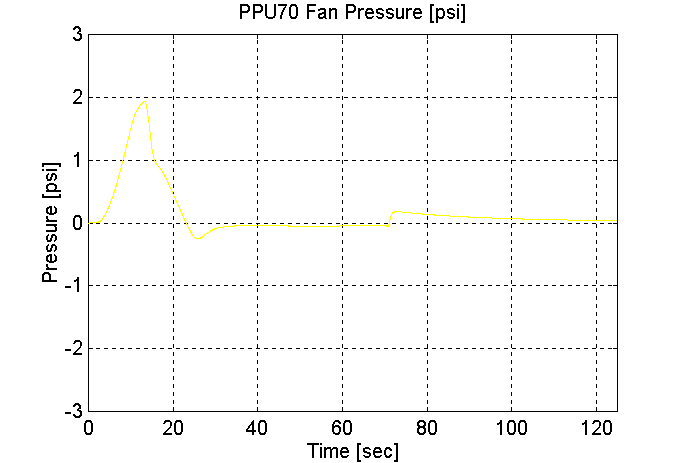
Figure 257. PPU70 Fan Pressure, Dual PPU’s, Station 1 to 2, Full Vehicle (Grade=0)
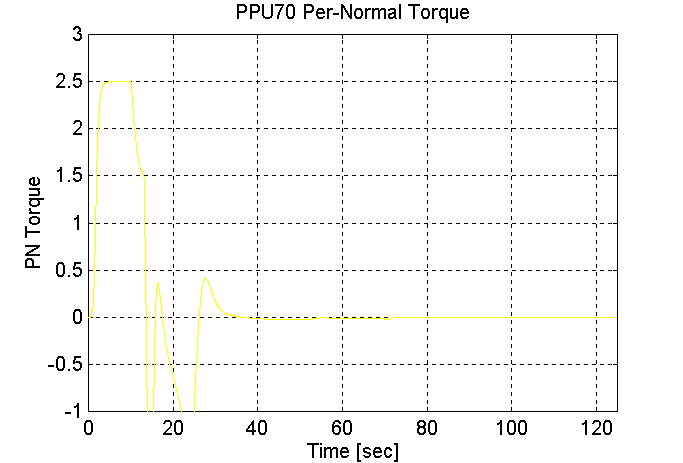
Figure 258. PPU70 PN Torque, Dual PPU’s, Station 1 to 2, Full Vehicle (Grade=0)
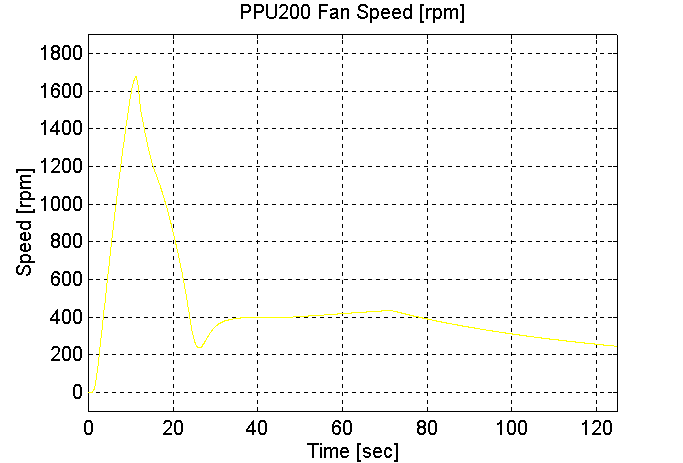
Figure 259. PPU200 Fan Speed, Dual PPU’s, Station 1 to 2, Full Vehicle (Grade=0)
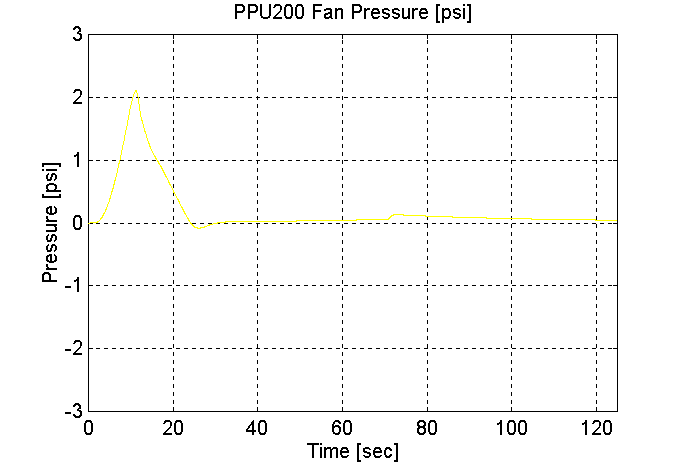
Figure 260. PPU200 Fan Pressure, Dual PPU’s, Station 1 to 2, Full Vehicle (Grade=0)
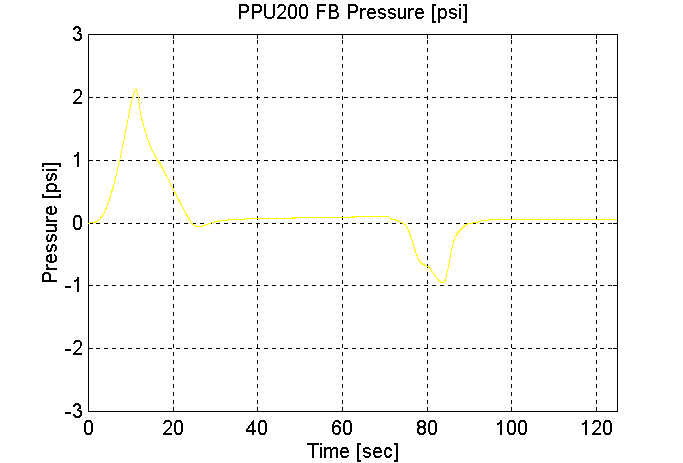
Figure 261. PPU200 FB Pressure, Dual PPU’s, Station 1 to 2, Full Vehicle (Grade=0)
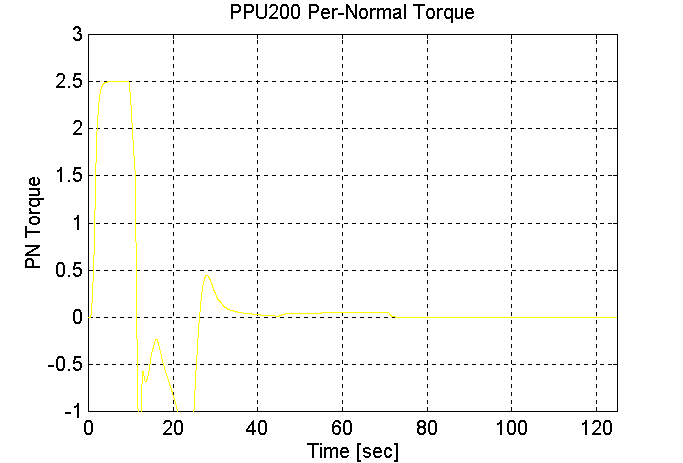
Figure 262. PPU200 PN Torque, Dual PPU’s, Station 1 to 2, Full Vehicle (Grade=0)
Empty Load (Single PPU’s Grade = 8 Vmax = 30 [kph])
Station 1 to Station 2 (PPU 200 pushing), Empty Vehicle, grade = 8.
Grade = 0
With Brakes
Single PPU
PPU200 -> PPU70
MV = 12300 [Kg]
Vmax = = 30 [kph]
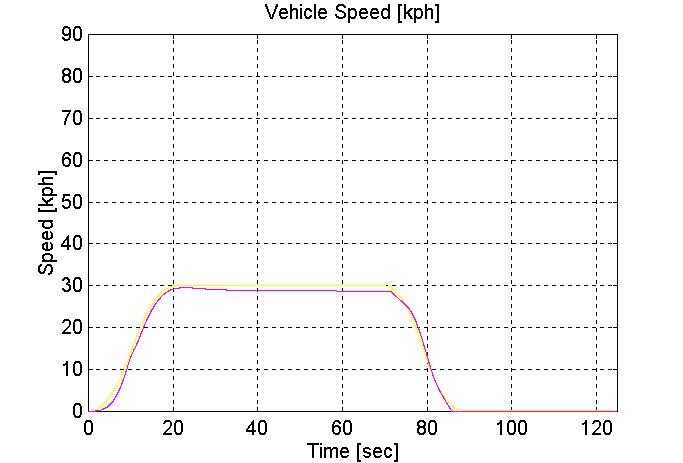
Figure 263. Vehicle Speed, Single PPU, Station 1 to 2, Empty Vehicle (Grade=8)
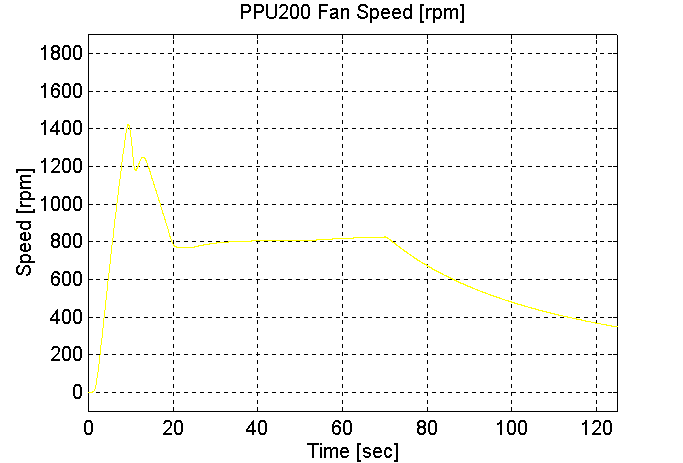
Figure 264. PPU200 Fan Speed, Single PPU, Station 1 to 2, Empty Vehicle (Grade=8)
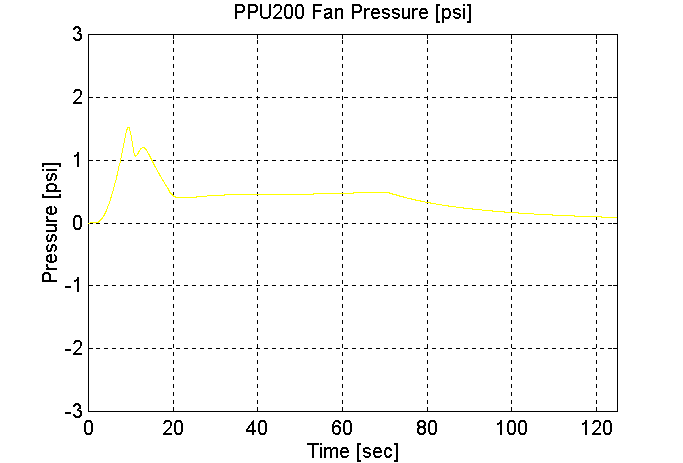
Figure 265. PPU200 FB Pressure, Single PPU, Station 1 to 2, Empty Vehicle (Grade=8)
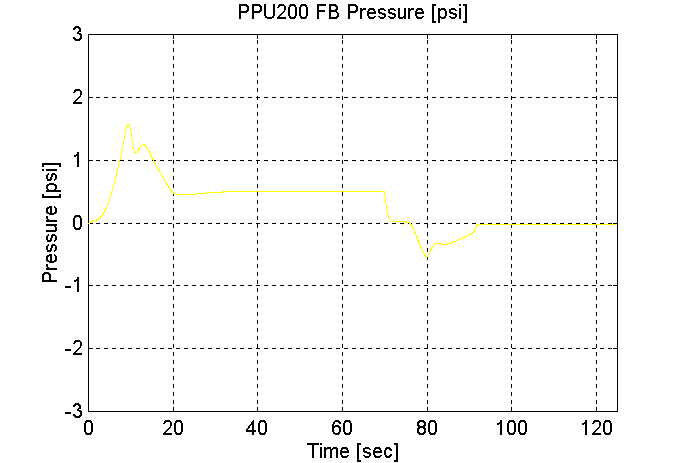
Figure 266. PPU200 Fan Pressure, Single PPU, Station 1 to 2, Empty Vehicle (Grade=8)
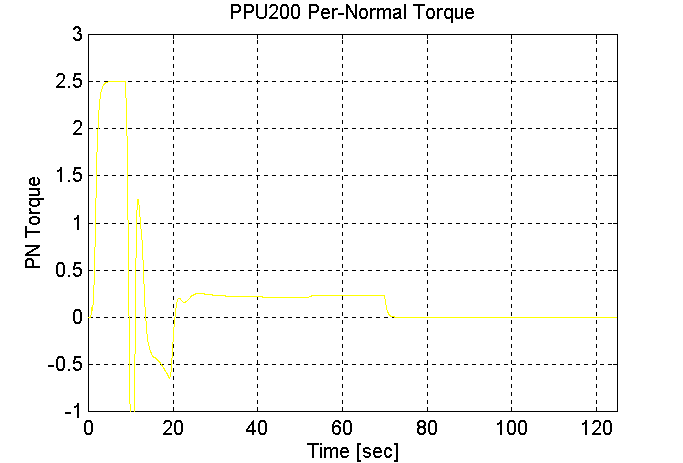
Figure 267. PPU200 PN Torque, Single PPU, Station 1 to 2, Empty Vehicle (Grade=8)
Mid-load Load (Dual PPU’s Grade = 8 Vmax = 30 [kph])
Station 1 to Station 2 (PPU 200 pulling, PPU70 pushing), Mid-load Vehicle, grade = 8.
Grade = 0
With Brakes
Dual PPU’s
PPU200 -> PPU70
MV = 21300 [Kg]
Vmax = = 30 [kph]
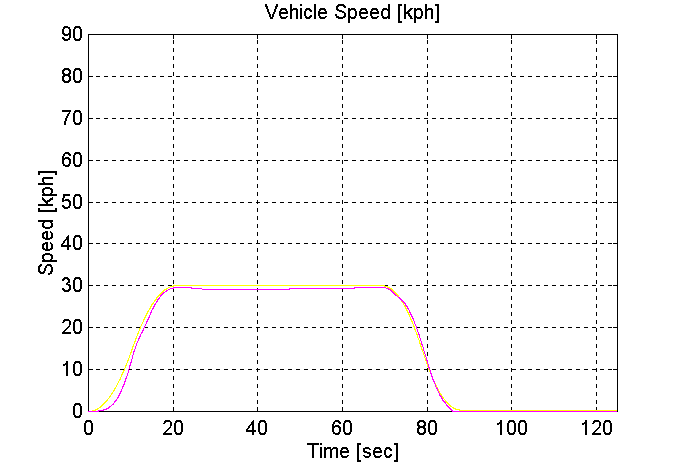
Figure 268. Vehicle Speed, Dual PPU’s, Station 1 to 2, Mid-load Vehicle (Grade=8)

Figure 269. PPU70 Fan Speed, Dual PPU’s, Station 1 to 2, Mid-load Vehicle (Grade=8)
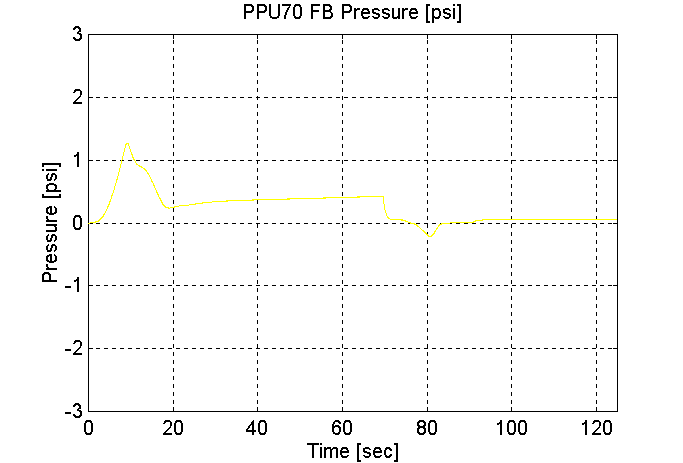
Figure 270. PPU70 FB Pressure, Dual PPU’s, Station 1 to 2, Mid-load Vehicle (Grade=8)
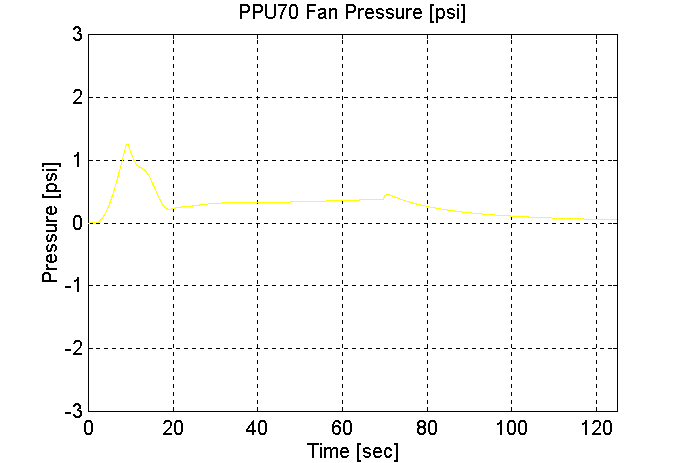
Figure 271. PPU70 Fan Pressure, Dual PPU’s, Station 1 to 2, Mid-load Vehicle (Grade=8)
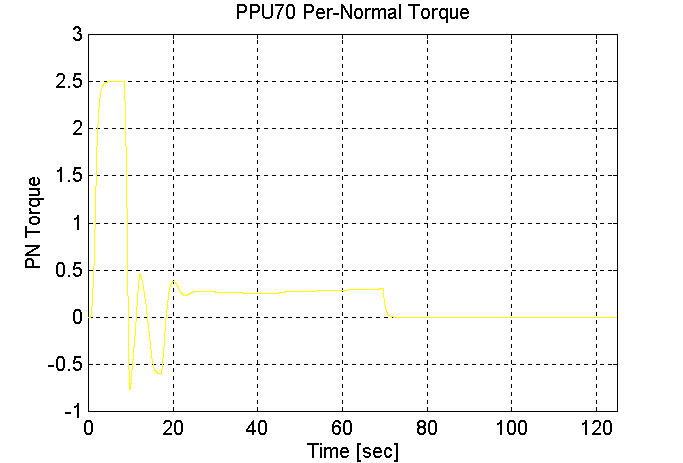
Figure 272. PPU70 PN Torque, Dual PPU’s, Station 1 to 2, Mid-load Vehicle (Grade=8)
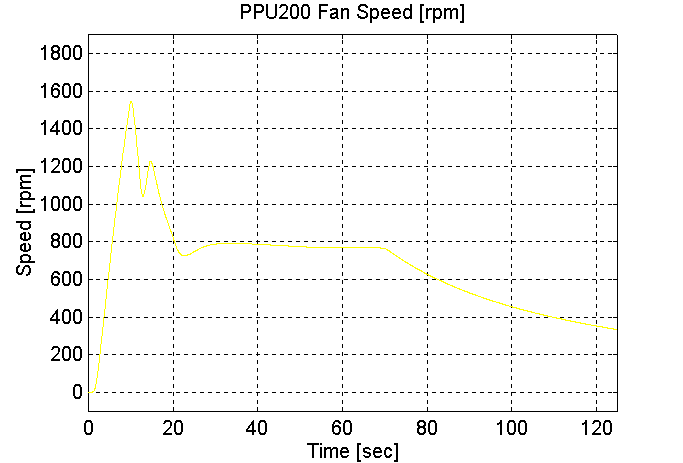
Figure 273. PPU200 Fan Speed, Dual PPU’s, Station 1 to 2, Mid-load Vehicle (Grade=8)
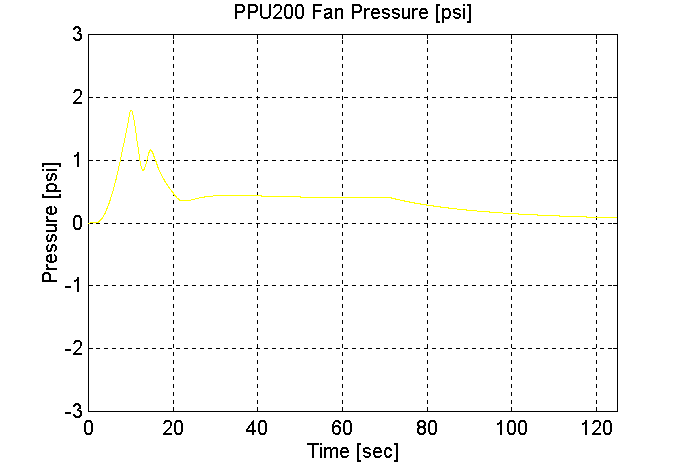
Figure 274. PPU200 Fan Pressure, Dual PPU’s, Station 1 to 2, Mid-load Vehicle (Grade=8)

Figure 275. PPU200 FB Pressure, Dual PPU’s, Station 1 to 2, Mid-load Vehicle (Grade=8)
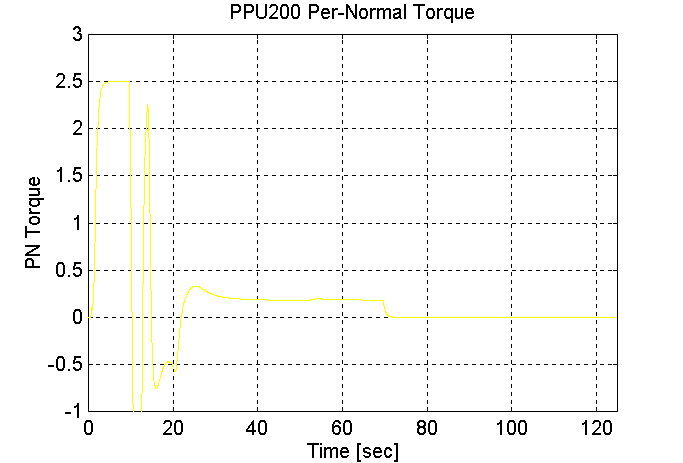
Figure 276. PPU200 PN Torque, Dual PPU’s, Station 1 to 2, Mid-load Vehicle (Grade=8)
Full Load (Dual PPU’s Grade = 8 Vmax = 30 [kph]))
Station 2 to Station 1 (PPU 200 pulling, PPU70 pushing), Full Vehicle, grade = 8.
Grade = 8
With Brakes
Dual PPU’s
PPU70 -> PPU200
MV = 30300 [Kg]
Vmax = 30 [kph]

Figure 277. Vehicle Speed, Dual PPU’s, Station 2 to 1, Full Vehicle (Grade=8)
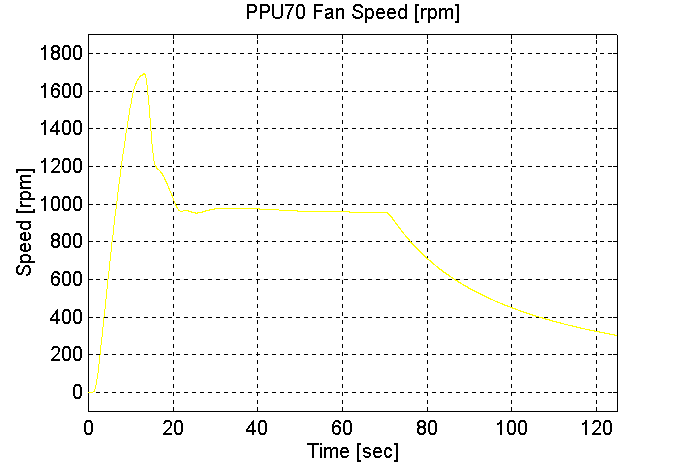
Figure 278. PPU70 Fan Speed, Dual PPU’s, Station 2 to 1, Full Vehicle (Grade=8)
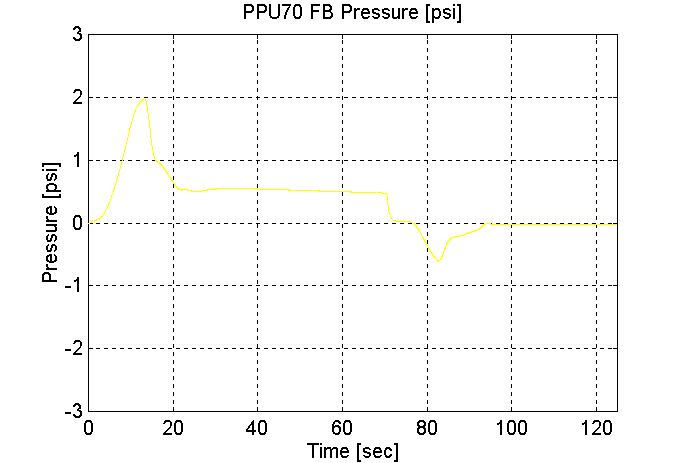
Figure 279. PPU70 FB Pressure, Dual PPU’s, Station 2 to 1, Full Vehicle (Grade=8)
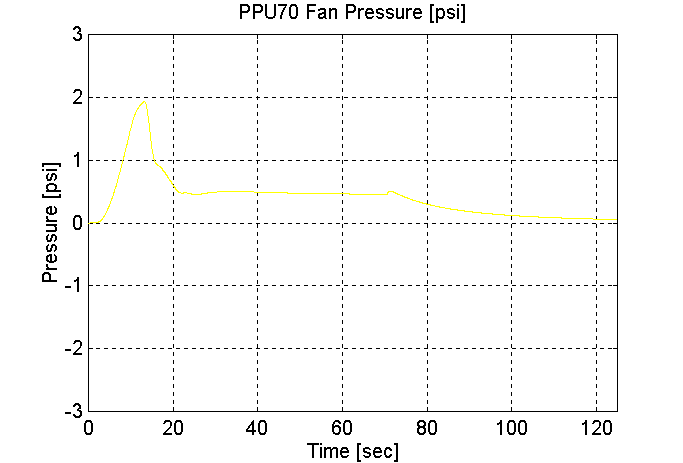
Figure 280. PPU70 Fan Pressure, Dual PPU’s, Station 2 to 1, Full Vehicle (Grade=8)
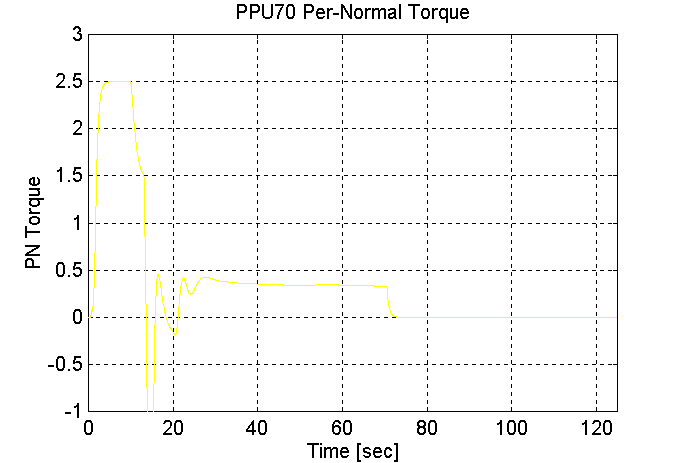
Figure 281. PPU70 PN Torque, Dual PPU’s, Station 2 to 1, Full Vehicle (Grade=8)
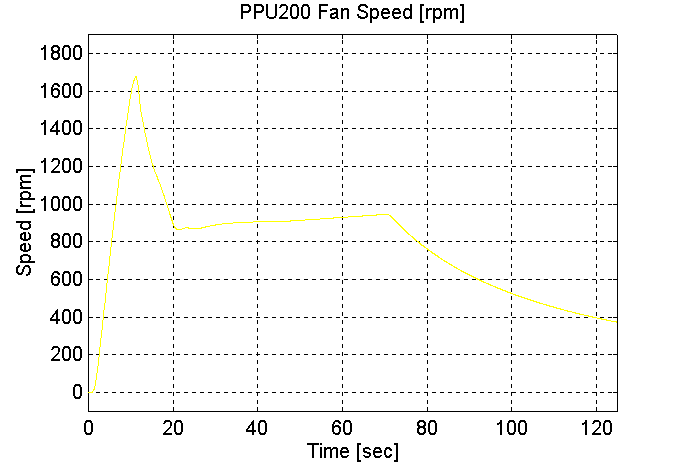
Figure 282. PPU200 Fan Speed, Dual PPU’s, Station 2 to 1, Full Vehicle (Grade=8)
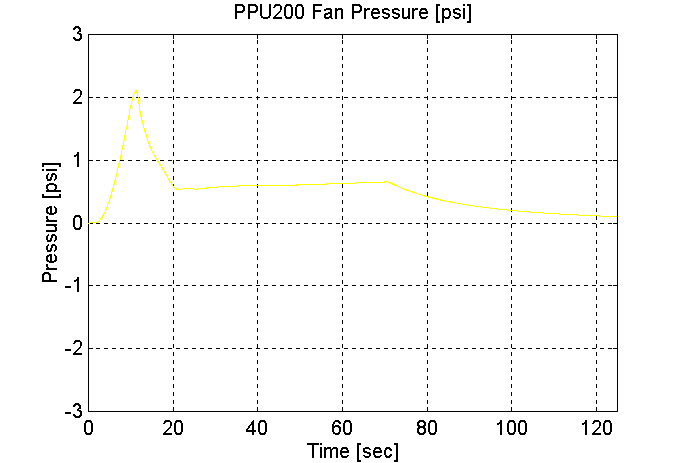
Figure 283. PPU200 Fan Pressure, Dual PPU’s, Station 2 to 1, Full Vehicle (Grade=8)
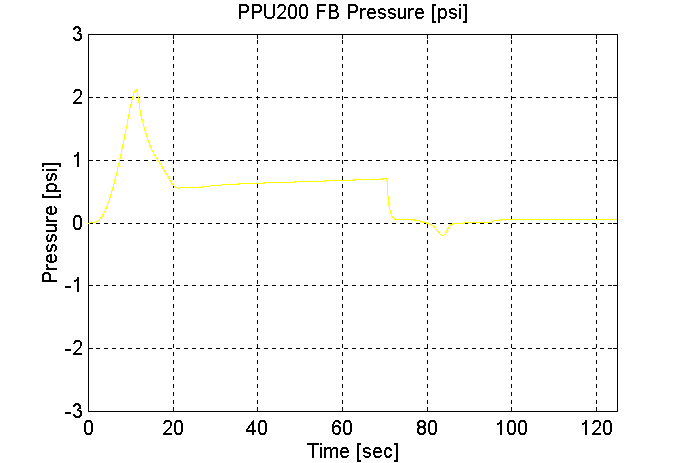
Figure 284. PPU200 FB Pressure, Dual PPU’s, Station 2 to 1, Full Vehicle (Grade=8)
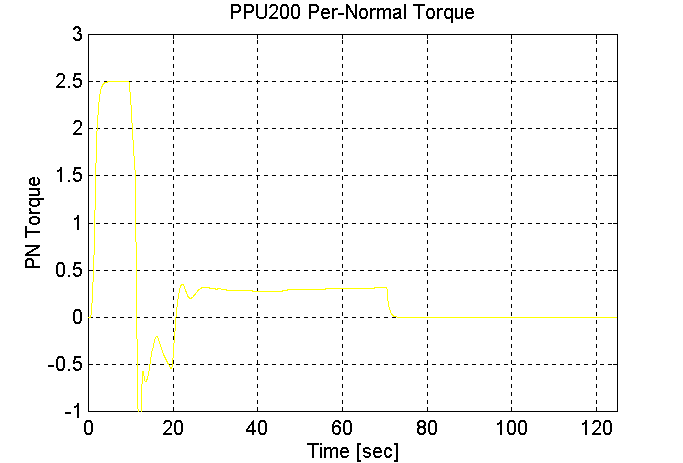
Figure 285. PPU200 PN Torque, Dual PPU’s, Station 2 to 1, Full Vehicle (Grade=8)
CHAPTER 5
Conclusions
Observations/Conclusions
The process of modeling and simulating the proposed Air-propelled people-mover control scheme provided the author with the following insights:
- The phase lag associated with the transport delay in the propulsion tube, limits the responsiveness of the Vehicle Speed regulator. Deploying a modern control based Vehicle speed regulator (for example a regulator with a smith predictor, designed with an accurate plant model) will only improve response to a command reference, it will not improve response to a disturbance. The same response to a command reference can be achieved in a much simpler fashion using feed-forward pressure references. Implication: To reduce complexity, and optimize response to a command reference, use a simple speed regulator with pressure feed-forward control.
- To position the Vehicle at a station, an approach similar to that used in the elevator industry should be employed. That is: Accelerate the Vehicle to the desired cruise speed, and monitor position. When the Vehicle reaches a pre-determined position on the track decelerate to a "Leveling speed". Once at the desired leveling speed (usually a very low speed), the Vehicle coasts for a short time until reaching the desired station stop point at which time the brakes are fully applied and the Vehicle is stopped. Implication: Disturbances such as wind, earthquakes, tidal waves etc. will generate an error in the Vehicle final position. To compensate for these disturbances an intelligent positioning algorithm can be closed around the Vehicle brakes, in much the same way the Vehicle is currently positioned. Alternatively, an algorithm that corrects the speed reference to accommodate for these disturbances can be developed, but is not presented in this report.
- To accelerate the Vehicle from stop to coast speed while satisfying the design constraints, the fan must be accelerated using 250% rated torque for as much as 10 [sec]. AC and DC motors can be designed to operate with this load torque for short periods of time. Care should be taken to ensure that motors are chosen with frames designed to handle these loads for the expected application duty cycle times.
- Care should be taken to ensure that physical limits are programmed into the regulators correctly, and that once a limit is reached all integrators in the control loop are clamped. This prevents wind-up in the integrators. For the pressure regulators, it may become necessary to program limits that vary with air mass-flow, and are based on the particular PPU blower characteristics.
- The proportional pressure regulator that is closed around the Fan speed regulator (during acceleration and run) will operate with a fixed steady state error that varies depending on the air mass-flow through the blower. To compensate for this steady state error a slow integrator was added to the Vehicle speed loop. This integrator should only be given as much control as the application requires.
- Acceleration and deceleration rates for the speed reference generator should be computed (or generated in a look up table) based on the Vehicle mass, and the worst-case analysis of available pressure, for a given PPU configuration.
- The Blower-Fan motors were observed to regenerate during the simulations. If a non-regenerative drive is to be used, care should be taken to ensure that the snubbers are sized adequately to absorb the expected regenerative energy, within the constraints imposed by the worst-case duty cyle of the Vehicle.
Minimizing Anticipated Start-up Difficulties3
To minimize difficulties during start-up, the author feels that care should be taken to ensure that the following tasks are performed correctly.
- Ensure that each PPU fan speed regulator is tuned for a 1 [rad/sec] loop bandwidth.
- For each PPU, ensure that the pressure loop (into fan speed) is tuned for a bandwidth of approximately 1-2 [rad/sec].
- For each PPU, ensure that the pressure loop (into valve position) is tuned for a bandwidth of approximately 1-2 [rad/sec].
- For each PPU, ensure that the feed-forward pressure references and the associated switch points are adjusted so that the Vehicle operates within design guidelines without closing the Vehicle speed regulator.
- For each PPU, ensure that the Vehicle speed regulator is tuned for approximately 0.1 – 0.2 [rad/sec] bandwidth.
This concludes the report.
|