APPLIED INDUSTRIAL CONTROL SOLUTIONS
ApICS LLC.
Winder Tension Control
an
Adaptive Control System Tutorial
T. Liu, (ra), B. T. Boulter
© ApICS ® LLC 2000
Abstract
In this tutorial a frequency response based adaptive control scheme with robust frequency domain specifications for industrial center-driven web winders is presented. The adaptive control scheme consists of:
- A self-tuning initialization.
- An adaptive controller, with robust design specifications, based on a transfer function estimation of the controlled plant from frequency response data taken from the plant.
- Supervisory monitoring and controls.
In the tutorial, the modeling of the plant is first investigated and then the adaptive scheme is described. The simulation results are described along with discussions of pertinent implementation issues.
Nomenclature
|
J |
per-normal instantaneous total inertia reflected to motor, [sec] (see [15]) |
|
w CO |
desired tension loop crossover frequency, [rad/sec] |
|
z |
desired tension loop damping factor |
|
D |
roll diameter [m] |
|
Nb |
motor base speed [rpm] |
|
E |
web’s Young's modulus of elasticity [N/cm^2] |
|
C |
web’s damping modulus [N sec/cm^2] |
|
A |
web cross-sectional area [cm^2] |
|
L |
strip length between bridles [m] |
|
GR |
gear ratio [ ] ] |
|
P |
motor power [kW] |
|
Vi |
line speed [m/sec] |
|

|
per normal torque generated by the motor (see [15]) |
|

|
per normal torque loss in the drive train system (Motor, gearbox and roller), it is simplified as a
linear function in this study,  (see [15]) (see [15]) |
|
K1 |
gain factor from per normal to engineering unit [m/sec] roll speed  |
|
K2 |
gain factor from engineering unit [N] to per normal web tension,  |
1. Introduction
A web transport system (WTS), which handles a continuous strip or web, can be found in many industries such as steel mills, paper mills, plastic and textile industries. A WTS usually consists of n+1 rollers with n tension zones. A winder, the last roll of a WTS, is often a limiting factor [1] to the overall effectiveness of the system control structure whose control performance will directly affect the quality of final product. A popular method of regulating winder tension is accomplished with various control logic and feed-forward approaches [5]. A typical feed-forward closed loop web tension hybrid regulator winder control system is shown in Fig. 1. Here the tension regulator is usually implemented with a PI controller using a distributed control system (DCS) or a programmable logic controller (PLC). In some applications the tension loop is cascaded with an intermediate speed loop. For the controller structure presented in this tutorial, the intermediate speed loop is not used.
The controlled web tension plant including the dynamics of a drive, motor, gearbox, roller, and the web tension can be described adequately from first principles [2], [6]. However unknown and time varying parameters make the implementation of a conventional analytical tuning algorithm a difficult task [4]. The tuning is usually based on worst case operating conditions and as a result of this, the control performance is inadequate. The controller is essentially de-tuned for most common operating conditions. Even so it is not uncommon for the regulator to become unstable during normal operation and re-tuning of the PI will be required.
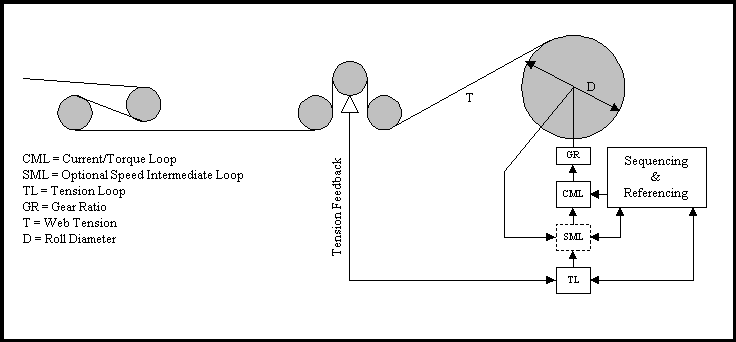
Fig. 1. Simulated Winder System
Many self-tuning and adaptive control approaches have been proposed but few has been applied to winder tension control applications. The reason for this is that the proposed algorithms are either not suitable for the application or too complex for the hardware and software that is currently used in DCS and PLC platforms.
In recent years, frequency response technique based adaptive controls have been proposed [4, 7-14]. Adaptive methods described in these approaches can be classified into several categories. The experimental method represented by the relay feedback tuning approach used extensively in process controls applications [7, 9] is popular. Using this method, a quick and stable tuning without apriori knowledge of the system can be obtained. This method yields useful information about the ultimate closed loop gain of the tuned controller, thus it has been suggested that it may be used to initialize an adaptive control system [8]. Another elegant method that has been implemented using system identification techniques in the frequency domain estimates the system transfer functions at a predetermined set of frequencies. Loop shaping techniques are then applied to identify a controller with the desired frequency domain specifications [4]. Other approaches simply use filters to estimate the transfer functions at a few specified frequencies [9, 10], but experience has shown that these methods do not easily yield reliable estimations of the plant.
In this tutorial, a frequency response based adaptive control algorithm with an easy-to-implement scheme and robust frequency domain performance specifications for the regulation of web tension in a center driven winder application is presented. The algorithm, utilizing derived general structure knowledge of the plant model, consists of:
- Self-tuning initialization,
- An adaptive control with robust frequency-domain specifications based on a transfer function estimation from the frequency response of the system.
- Supervisory monitoring and controls.
In the self-tuning initialization stage, the relay feedback [7] method, whose usual application use is to identify the loop ultimate gain and 1st order response frequency, is used to identify the dominant 2nd order natural frequency and damping of the plant. In the adaptive control stage, a probing signal at the identified specified frequency is used to stimulate the plant. Signals to and from the plant are then retrieved through band-pass filters as described in [9,10]. Using the information obtained from these signals, the dominant 2nd order natural frequency and damping of the plant is estimated on-line. Based on the estimated transfer function of the plant, a controller structure is determined and tuned to yield a robust closed loop regulator design. In the supervisory monitoring and control mode, a set of system operating conditions is monitored, from these measurements the dynamic closed loop performance of the system is estimated, and based on these observations a decision defining when to re-initiate the adaptation process will be determined. A novel feature in this task is to monitor the dynamic control performance of the closed loop system by estimating the frequency response at the specified crossover frequency.
This tutorial is organized as follows. The system model will be investigated in section 2. The control algorithm will be presented in section 3. The simulation results will be discussed and implementation issues will be addressed in section 4. The conclusions will be given in section 5.
2. System Modeling
It can be shown that, applying the mass conservation law between the lead roll and the winder roll, and Hook’s law for the elasticity of the web, the following equation can be derived to model the web dynamics in the given tension zone [2,4,6].
 ;(1) ;(1)
By Newton’s second law, summing the torques at the winder roll motor shaft:
 ; (2) ; (2)
where
 ; (3) ; (3)
Based on the above dynamic equations, the block diagram describing this system can be built (Fig.2).
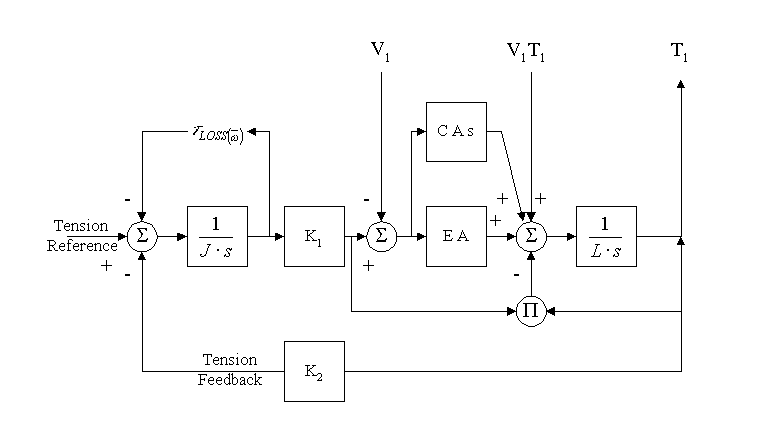
Figure 2. Block diagram of the web tension zone of center-driven web winder
Linearizing the block diagram, the transfer functions from motor torque to the torque applied to the web can be obtained (4):
 (4) (4)
(4) can also be expressed as (5):
 ; (5) ; (5)
where,
 ;(6) ;(6)
 (7) (7)
 ; (8) ; (8)
 ; (9) ; (9)
Note that, in equation (8), the term B1V1/(JL) is usually very small compared to the rest of the terms in the equation, and can be ignored. The natural frequency an then be approximately expressed as (9):
 ; (9) ; (9)
This implies that all the motor torque is being applied as tension in the web, and that losses are not significant. In practical implementations this fact is particularly true because feed forward torque loss compensation is often used [5]. This ensures that the torque loss term in (8) is effectively canceled in the closed loop system dynamics. In this tutorial it is also assumed that the line velocity time constant tp is small enough such that 1/ tp >>wp. Given the line speeds of most practical web/strip transport this assumption is a reasonable one. Based on this assumption, the time constant tp will be ignored in the identification scheme described in the following section. For simplicity, the web tension is normalized as described in [15], thus the resulting tension loop plant transfer function is same as that described in [4] .
From the above derivations it can be seen that plant behavior is dominated by a dominant 2nd order pole pair with natural frequency wp and a damping of zp. The natural frequency is a function of the physics of the machine (K1, K2, J, L), the properties of the web (E, A, C), and the line speed (V1). The natural damping is attributed to the friction of the mechanical system (B1), the bulk movement of the web (V1 ), and the web damping (C). The above equations provide a general description of the described system, however it is generally difficult to analytically obtain values for these equation parameters. This is due to the fact that the web modulus E is non-linear and time varying. The relationship between stress and strain varies with tension, humidity, and temperature. The web damping co-efficient C is difficult to measure and also depends on operating conditions such as humidity and temperature. The extent of these variations is dependant on the web material itself. In web/strip transport systems, there exists strong coupling between the winding tension zone and previous tension zones. The effect of this coupling is to lower the natural frequency and increase damping [3] and is very difficult to quantify. However, the model structure is predictable, and consists of a dominant 2nd order natural frequency.
3. Frequency Response Based Adaptive Control Scheme
Based on the plant model structure described above, the adaptive control scheme is designed to identify the dominant 2nd order natural frequency, and design the regulator such that a desired closed loop response is obtained. The adaptive control algorithm is comprised of three tasks:
- The initialization algorithm,
- The adaptive control and plant transfer function estimation algorithm,
- The supervisory monitoring and control algorithm.
The desired system performance specifications expressed in the frequency domain and the desired controller structure selection will be explicated first.
Performance Specifications and controller Structure
An important objective of any controller design in the frequency domain is to maintain a desired loop shape as shown in Fig. 3.
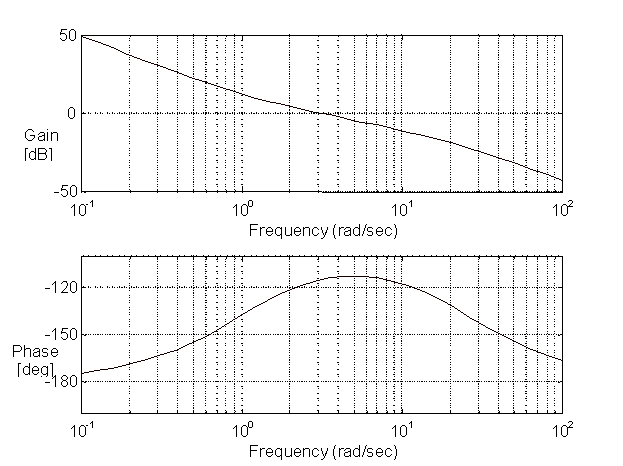
Figure 3. A typical desired loop shape in frequency domain.
To minimize steady state error, the loop shape has high gain at low frequencies and, to minimize sensitivity to noise, high gain attenuation at high frequency. It is also designed to provide a set of desired phase and gain margins at given gain and phase crossover frequencies, respectively. For a web transport system, it is often a requirement to specify the bandwidth of each tension zone in order that all sections exhibit identical tension command and disturbance rejection response characteristics. This is equivalent to specifying the gain crossover frequency in Fig. 3. To meet this objective with the plant model in equation (4), the controller for the winder control can be derived, using a loop-shaping technique, as described below:
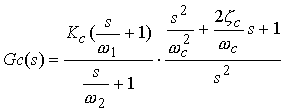 ; (10) ; (10)
where the zero pair (wc , zc) is tuned to approximately cancel the pole pair (wp , zp), the lead compensator (s/w1+1) is tuned to provide adequate loop phase margin, the lag compensator 1/(s/w2+1) is deployed to provide high frequency attenuation. Note that the closed loop phase margin is related to the damping of a second order system. The controller parameters are tuned for:
 ;(11) ;(11)
 ;(12) ;(12)
 ;(13) ;(13)
where wCO, and z are the user-specified open loop crossover frequency [rad/sec] and closed loop damping factor of the designed system. Equation (11) allows for specifying phase margin using the familiar damping term in a second order system. w2 is tuned such that the system response is dominated by the specified crossover frequency and damping. This is accomplished by maintaining the defined frequency ratio between w1 and w2. In the controller, the only information needed to tune the regulator are the user specified crossover frequency and damping factor, and the plant natural frequency and damping.
Note that pole/zero cancellation is utilized in the determination of the controller structure. As a general rule pole/zero cancellation of 2nd order natural frequencies is not recommended if the damping of the natural frequency is less than 0.1. In winder applications the damping of the dominant 2nd order natural frequency is rarely less than 0.2, and pole/zero cancellation is applicable.
Self-tuning Initialization
Experience has shown that commissioning and manually tuning a winder tension control system for the first time is a difficult and time consuming task. This is because unstable tension control encountered during commissioning may lead to web breaks and consequently, a need to re-thread the machine. The relay feedback method [7] provides a controllable oscillation from which very useful system information can be obtained. In this application, the relay feedback test is performed at the frequency where the dominant 2nd order frequency phase shift is -90 degrees. During the relay test, the frequency w90 and magnitude a90 of the web tension oscillation is measured. From the plant model in (4), assuming 1/tp >> wp, the phase due to the lead term at the -90 degree frequency can be ignored. Therefore the estimated natural frequency is (14)
 ;(14) ;(14)
As discussed in section 2, the gain kp in the model (4) is approximately equal to 1. Based on the ultimate gain formula in [7], and also the fact that an integrator is added before the relay block, the estimated natural damping factor is (15)
 ;(15) ;(15)
where m is the relay output amplitude. Based the estimated natural frequency and damping factor, the controller parameters in (10) are tuned as:
 ;(16) ;(16)
On-line Transfer function estimation and adaptive control
The transfer function estimation method introduced in [9, 10] is used here. From the above discussion, the only critical information needed for the model (4) is the natural frequency and damping. Although these parameters are estimated in the initialization stage described above, they will change with different winder roll diameters, line speeds, and materials. Because of this, on-line system identification is needed. The main idea behind the identification method is to identify the instantaneous natural frequency and damping using the parameters obtained from the previous natural frequency and its associated damping determination. This is accomplished by injecting a probing signal at the specified frequency with a small amplitude, such as 1-2% of 1 per-normal tension. The plant input and output is then filtered using band-pass filters [10], one for each signal. The filters applied in this application have the form of:
 ; (17) ; (17)
The frequency of the injected signal is selected to coincide with the frequency wp_est of the previous natural frequency determination. Depending on the particular operating point in the identification algorithm, an appropriate value of damping zf is chosen. When the signals are not being detected, this parameter is set to a large value (>1). This is done to ensure that the effect of previously injected noise and disturbances, in particular load changes, will sufficiently extinguish in time for the injection of a new probing signal. When the next probing signal is issued, the damping is reduced to a preset under-damped value (such as 0.05). Kf is then utilized to adjust the magnitude of the signals that are to be detected at a different frequency to the measured values. The frequencies and amplitudes of the detected signals are then estimated using a least-square estimator using sampled data taken from a sufficiently long period of time. This period of time can be adjusted to ensure that the plant transfer function estimation is adequate for the defined control problem.
Assume that ks and js are the estimated magnitude and phase at the frequency ws, the new plant natural frequency and damping factor can be estimated by solving the following equations:
 ;(18) ;(18)
 ;(19) ;(19)
Note that the current measured phase js should be close (within +/- 5o) to the actual phase of -90 degrees. This is because there should not be a dramatic change in the plant parameters between the current and previous identification routines. If this does happen, and the system becomes unstable, the user will be required to intervene, and a regulator initialization will need to be performed. Assuming that there is no dramatic change in the plant parameters, the solutions from (18,19) will be satisfactorily accurate. Assume that wp_est and zp_est are the new estimated plant natural frequency and damping. The controller is then re-tuned using the following settings:
 ; (20) ; (20)
Supervisory monitoring and control scheme
The purpose of the supervisory task is to monitor system operating conditions and regulator performance to determine when to perform the next plant transfer function estimation and re-tune the controller. The following information sets are monitored.
- Self-tuning initialization commands.
- System operating conditions such as the line speed, roll diameter, winding roll change logic (to detect material changes), and so on.
- Adaptive control algorithm commands including scheduled updates (such as once a minute), and any unscheduled updates from the upper supervisory level or operator.
- Dynamic system control performance estimated from the frequency response.
To monitor the control performance on-line, a probing signal with a small amplitude at the specified desired tension loop crossover frequency is issued. The resulting tension error is filtered and the magnitude and phase shift of the resulting error are estimated using a least square estimator. Using these estimated values, the open loop gain and phase at the specified crossover frequency is then identified. Performance is then compared to a predetermined set of criteria, and based on these comparisons a decision is made to determine if an update to re-tune the controller should be performed.
The results of the above described monitoring tasks are categorized into four response types:
- Perform the regulator initialization and set the initialization trigger on,
- No adaptive action will be taken and turn off all the triggers,
- Perform the adaptive control and set the adaptive control trigger on
- The system is not controllable, issue a fault alarm.

Fig. 4 Proposed Adaptive Control Architecture
A diagram of the proposed adaptive control scheme is shown in Fig. 4. The probing signal is seen to be added to the reference input node. Three signals, controller error, controller output, and the plant tension feedback, are fed into the filter bank. These signals are used by the filter algorithm to estimate the plant natural frequency, and the regulator closed loop performance metrics using a least square estimation algorithm. The supervisory task monitors control error, upper level control and inputs, and the estimated data. It also determines the controller structure and tuning parameters, and controls the estimation sequences performed by the filter bank. The adaptive control algorithm is summarized as follows.
1o Self-tuning initialization.
- Set the controller structure to an integrator plus a relay block;
- Estimate the tension oscillation frequency and amplitude ;
- Find the natural frequency and damping of the plant;
- Set the controller structure as shown in (10) and tune the controller according to
equations (11), (12), (13), and (16);
1.5 Go to Step 3o.
2o Adaptive control.
2.1 Issue a probing signal at the previously estimated natural frequency;
2.2 Filter the plant input and output signals at the same frequency;
2.3 Identify the new natural frequency and damping;
2.4 Re-tune the controller parameters using (11), (12), (13), and (20);
2.5 Go to Step 3o.
3o Supervisory monitoring and controls.
3.1 Monitor the four sets of information described above. ;
3.2 If the initialization trigger is true, go to step 1o;
3.3 If the adaptive control trigger is true, go to step 2o;
3.4 If an uncontrollable fault is detected, issue the fault alarm and go to manual operation;
3.5 Go to Step 3.1.
4. Simulated and Actual Results. Implementation Issues
Simulation Results and discussion
An ApICS LLC client with a PLC5 based web transport system testing line offered to allow ApICS LLC to verify the efficacy of the proposed algorithm on their test line. The line has a winder with the parameters listed in the table below. This line was first simulated using Matlab/Simulink and results from these simulations are presented. Upon verification through simulation, the algorithm was installed at the test facility, and results from this installation are also presented.
Table 1. System data
|
E |
2x10⁵ [N/cm2] |
|
C |
4 x10³[N sec/cm2] |
|
A |
0.05-0.1[cm2] |
|
L |
10 [m] |
|
Motor power |
5 [kW] |
|
Motor base speed |
1000 [rpm] |
|
Gear Ratio |
3 |
|
Core Roll Diameter |
0.2 [m] |
|
Full Roll Diameter |
2 [m] |
|
Max Line Speed |
210 [m/min], 3.5 [m/sec] |
Simulations of the proposed system were performed and results from four cases presented as follows. The first case represents a typical stall operating condition where the winder is at core diameter and stalled (zero speed). The second case is simulated at core roll diameter while the line is accelerated from stall to maximum line speed. This line speed change significantly affects the plant natural damping and slightly changes the plant natural frequency. The third case is simulated with the winder at full roll, and maximum line speed. In this case the system has significantly differing characteristics than those of case 1. In this application the change in the radius squared is significantly greater than the change in inertia therefore the natural frequency of the system a full roll is three times higher than that found in the first case, or at empty core. In case 4 the simulated material has a significantly smaller web cross sectional area than that simulated in the previous three cases. In all cases, the specified crossover frequency of the tension regulator is set at wco=5 [rad/sec] and the damping factor of the closed tension loop is set at z=1.5. The results on all graphs are shown normalized [15].
Case 1.
In case 1, self-tuning initialization was executed. The relay test was performed over the time period t = 0 to 5 [sec] as shown in Fig. 5. The filter algorithm estimated the oscillation frequency or the natural frequency to be 3.9 [rad/sec] with a damping factor of 0.289. The tension regulator was tuned using the estimated data. A reference step input was injected at t=5 and a load step change was applied at t=15 [sec]. The step and load response of the web tension in Fig. 5 clearly show that initialization tuning was successful and that the system performance after tuning matched the desired closed loop bandwidth and damping specifications (Tp = 0.6 [sec] 10% O.S.). Note that the disturbance rejection capabilities of the tuned regulator allowed only one cycle of oscillation in the load response. This indicated that pole/zero cancellation of the dominant 2nd order natural frequency was satisfactory. Fig. 6 shows the identification signal test at t=25-30 [sec] when a probing signal with the above estimated frequency was issued by the supervisory controller. The estimated frequency from this test is, for all intents and purposes, identical to the one detected in the relay initialization test. Fig. 7 shows the monitoring signals at t=25-30 [sec] when the probing signal was issued with a frequency equal to the crossover frequency. It can be seen that at the specified crossover frequency, the actual loop gain was indeed equal to about 1, and the phase margin was approximate 80 [degree]. From these observations it can be stated that the system is stable, bounded and well behaved at this operating condition.
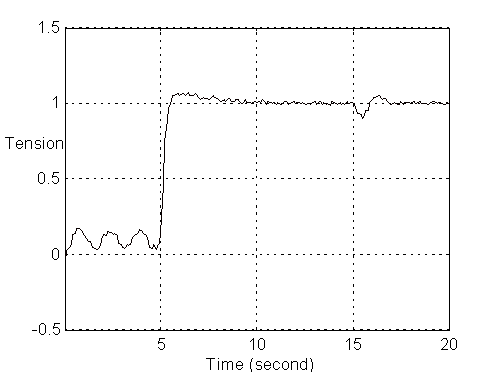
Figure 5. Tension response in the initialization process in case 1. The estimated natural frequency wp=3.9 [rad/sec] and damping zp=0.289
(Case 1: A=0.1[cm^2], D=0.2[m], V=0.)
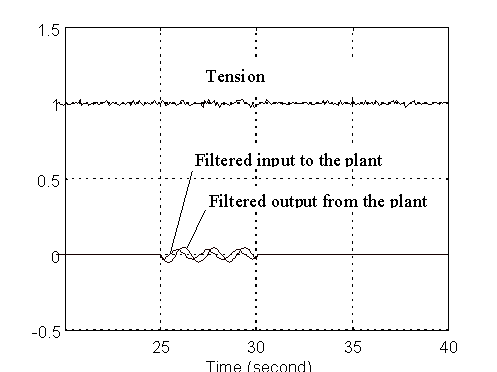
Figure 6. Identification signals at t=25-30 [sec] in case 1. The estimated natural frequency wp=3.927 [rad/sec] and damping zp=2.894
(Case 1: A=0.1[cm^2], D=0.2[m], V=0.)
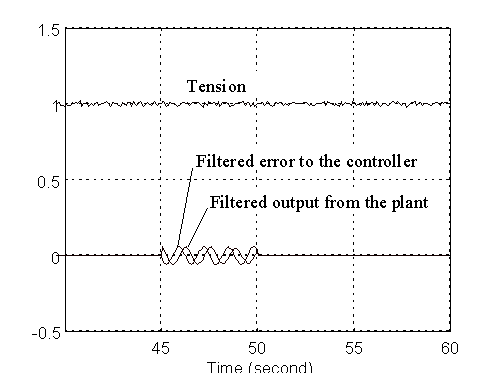
Figure 7. Monitoring signals at t=25-30 [sec] at specified crossover frequency wco=5 [rad/sec].
(Case 1: A=0.1[cm^2], D=0.2[m], V=0.)
Case 2.
Fig. 8 shows the tension response taken at empty core at maximum line speed, without the execution of the adaptation algorithm. Compared to the empty core response in case 1, there is only slightly more overshoot. This is because the natural frequency did significantly change as a function of line speed, and while there was some change in damping it also was not significant. If the maximum line speed was 10 or 20 times greater than that shown in this application, significant changes would be observed [3]. Fig. 9 shows the tension command step response after the adaptive algorithm re-tuned the controller. It can be seen that the more precise pole/zero cancellation that resulted from the re-tuning resulted in a closed loop performance that is identical to the stall condition in case1.
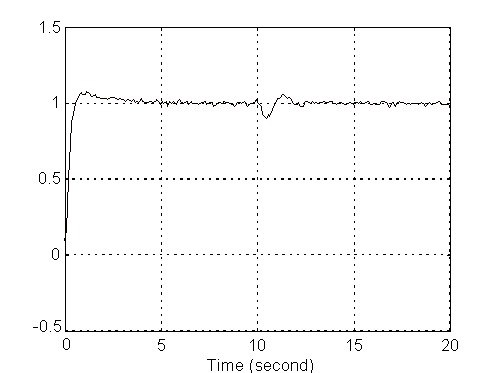
Figure 8. Tension command and load step response without adaptation, at maximum line speed.
(Case 2: A=0.1[cm^2], D=0.2[m], V= 3.5 [m/sec])
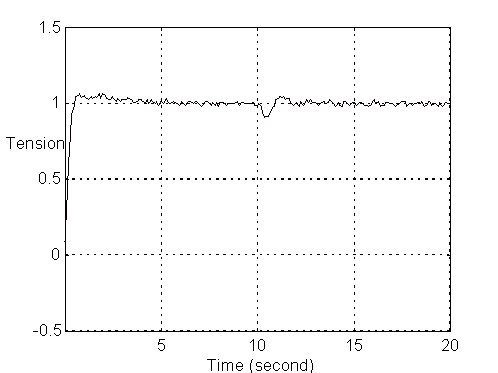
Figure 9. Tension command and load step response after adaptation at maximum line speed.
(Case 2: A=0.1[cm^2], D=0.2[m], V= 3.5[m/sec])
Case 3.
In case 3 the tension controller is tuned with and without adaptation. In Fig. 10, without adaptive re-tuning of the tension regulator, the less than ideal pole/zero cancellation results in a less than ideal step response. It is interesting to note from Fig. 10 that load shock recovery is better with this tuning. This is because the regulator zero pair is located at a more damped location in the s-plane. Fig. 11 shows the web tension response after adaptation re-tuned the tension regulator. The reference step response in Fig. 11 is almost identical to the previous reference step responses, however the load shock recovery was not as damped. This indicates that tuning with exact pole/zero cancellation does not produce as robust disturbance rejection as other tunings may provide. This phenomena was explained very well in [16]
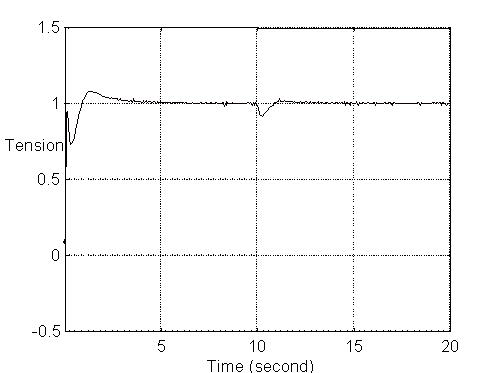
Figure 10. Tension response without adaptive control at full roll in case 3.
(Case 3: A=0.1[cm^2], D=2[m], V=3.5[m/sec])
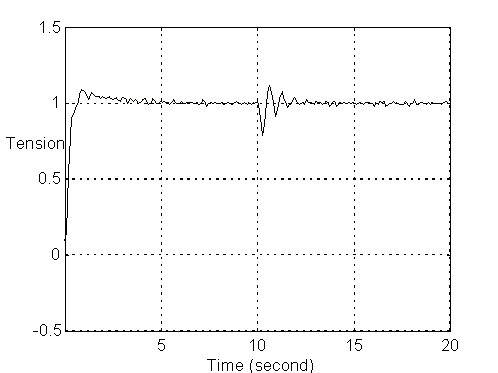
Figure 11. Tension response with adaptive control at full roll in case 3.
(Case 3: A=0.1[cm^2], D=2[m], V=3.5[m/sec])
Case 4.
Fig. 12 shows the tension response without adaptive control. It can be seen that the system performance became much worse because of the smaller web cross section area. This worse performance was also predicated using the proposed monitoring method as shown in Fig. 13. At the specified crossover frequency, the open loop gain is about 0.5 which is much smaller than the specified unit gain. After re-tuning the regulator using the adaptive control algorithm, the control performance was greatly improved, as shown in Fig. 14. Regulator performance, as estimated using the filter algorithm, was found to be similar to that shown in Fig. 7. In addition the loop gain at the specified crossover was equal to unity.
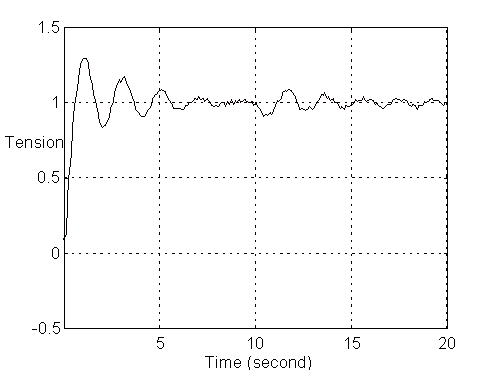
Figure 12. Tension response without adaptive control with a smaller cross section area.
(Case 4: A=0.05[cm^2], D=0.2[m], V=0.)
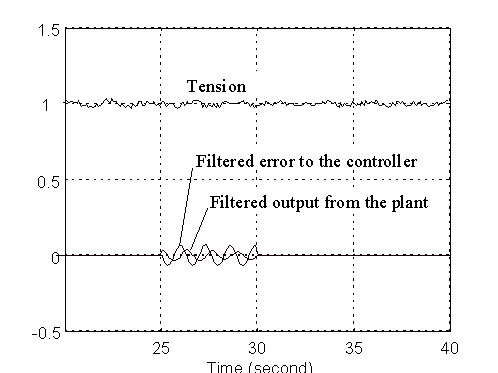
Figure 13. Monitoring signals at t=25-30 [sec] without adaptation at wco=5 [rad/sec]
(Case 4: A=0.05[cm^2], D=0.2[m], V=0.)
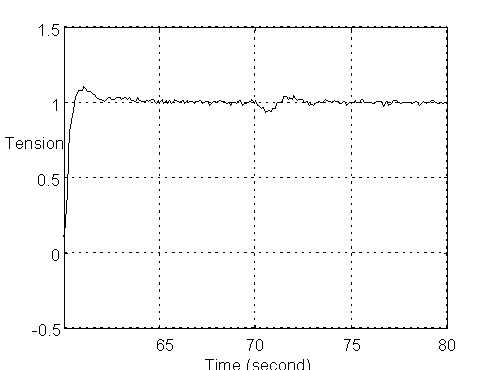
Figure 14. Tension step response with adaptation
(Case 4: A=0.05[cm^2], D=0.2[m], V=0.)
Simulated Noise
In all case examples presented, white noise with 1% P.N. magnitude was added to the load cell sensor feedback, and 2% P.N. magnitude was added to the motor torque. The addition of noise in the simulation affects the accuracy of the detected signals, and provides some idea of the ability of the filter estimation algorithm to reject noise and provide adequate estimations. It should be noted however, that even with an excitation signal that has an amplitude close the injected noise level, the filter algorithm is able to provide reasonable estimations. This is because the white noise power is evenly distributed over the sampled spectrum, and is therefore not significant at the fairly narrow band-pass frequency of the filter. In addition, the use of a large damping factor in the filters during the time when detection was not performed aided greatly in negating the effect of noise on the signals when detection was performed. As an interesting side note, it was found that a good source of excitation for the filter algorithm, came from the tension reference step change. If the identification is to be performed at the time of a command reference step change it is not necessary to issue an additional probing signal.
Actual PLC Test Line Results
A "boiled down" version of the algorithm was implemented on a PLC5 based system at an ApICS LLC client web transport system test line. The filter algorithms were included along with a discrete regulator implementation that allowed for real time updates while the line was running. Data was obtained using a standard Rockwell Software data collection package designed for PLC5 based systems. The following results were obtained.
In Fig 15 a tension feedback response that resulted from a torque step is shown. In this example the winder is at empty core, and the line speed was 1[m/sec]. Using standard step response to frequency mapping techniques [5] the natural frequency and damping of the system were estimated as: wp=3.3 [rad/sec] zp=0.33.
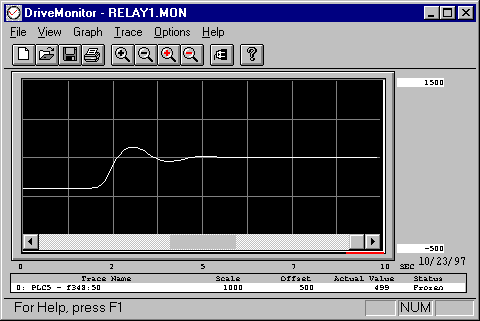
Fig. 15. Tension response from a torque step test using the test PLC Winder Drive system.
Fig.16 shows the tension response when a relay feedback regulator intialization test was executed. From the measured stimulation and response the natural frequency and damping were estimated by the filter algorithm as: wp w90=2.82 [rad/sec] zp=0.31. This result closely co-incided with the results from the simulation. This was true despite the effect of the inherent system sampling transport lag time ( w90=2.82 [rad/sec] zp=0.31. This result closely co-incided with the results from the simulation. This was true despite the effect of the inherent system sampling transport lag time ( 0.05 [sec]), which was ignored in the estimation. It can be clearly seen that the estimated parameters are comparable with those from Fig. 15. 0.05 [sec]), which was ignored in the estimation. It can be clearly seen that the estimated parameters are comparable with those from Fig. 15.

Fig. 16. Tension response from relay feedback test using the test PLC Winder Drive system.
Fig 17. Shows the response of the adaptively tuned regulator to a tension command reference step. The tension PID controller was tuned using the natural frequency and damping from the relay feedback test, i.e., wp=2.82 [rad/sec] zp=0.31. For this step test the crossover frequency of the regulator was set at: wco_ten=2.5 [rad/sec]. Note that this is close to the measured under-damped natural frequency of the system.
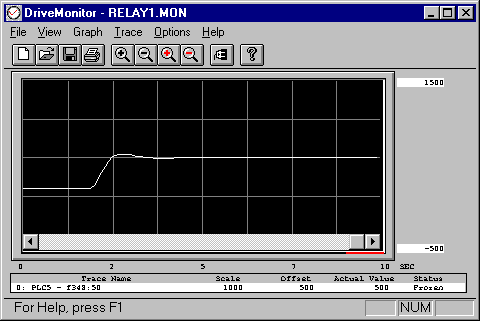
Fig. 18. Tension step response with adaptive tuning of the winder regulator: wco_ten=2.5 [rad/sec].
In Fig. 18 the response of the adaptively tuned regulator to a tension command reference step similar to that shown in Fig. 17 is shown. As above, the tension PID controller was tuned using the natural frequency and damping from the relay feedback test. However for this step test the crossover frequency of the regulator was set at: wco_ten=5 [rad/sec]. Note that this is greater than the measured under-damped natural frequency of the system. This indicates that the approximate pole/zero cancellation employed by the adaptive control structure was effective in a real system implementation.
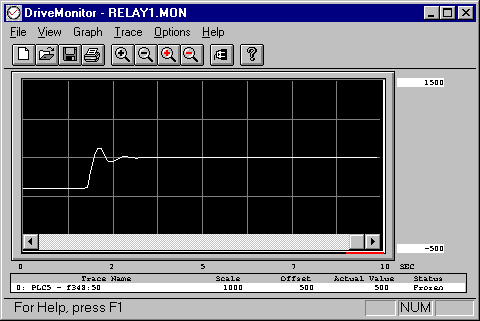
Fig. 18. Tension step response with adaptive tuning of the winder regulator: wco_ten=5 [rad/sec]
Implementation Issues
When implementing the proposed algorithm, the following issues need to be addressed. Firstly web winder control systems are commonly implemented using DCS or PLC hardware/software packages. These systems network the sensors and drives, thus transport lags are present in all feedback and reference signal paths. If the transport delay time is large enough such that the filter estimation algorithm -90 degree phase detection frequency is shifted by the delay time, then no useful information identifying the plant natural frequency can be obtained. The effect of transport delays can be negated if all signals that are fed into the estimator are equally delayed, such that the time stamps of signal stimuli and responses are synchronized.
Secondly, probing stimulus signals are required to execute the identification scheme. If frequent adaptive control is required, the stimulus required to perform the estimation, and performance tests, will itself add a disturbance to the system. This may not be practical in certain applications, such as strain-sensitive polymer and photo-mask lines, as these applications require precise regulation of tension and cannot tolerate the addition of tension disturbances. This is true even though very small stimulus signals may be added, the magnitude of such signals in these applications would be too insignificant to yield satisfactory estimations, and would therefore be unreliable.
Finally the identification process needs to be executed in a finite period of time. In the practical implementation on the test line, and in simulation, it was found that a period of at least 5 sec was required to obtain a reasonable estimation. This method is therefore not applicable to systems where fast adaptation is required.
5. Conclusions
In this tutorial a frequency response based adaptive control scheme for center-driven web winders is proposed. Given the ease of implementation, and resulting stable control and monitoring algorithms, and extensive simulation results, the control algorithm has shown the promise for not just the described application, but any of industrial web winder control systems with different configurations, and many other industrial process control systems.
REFERENCES
- Duuzinski, M.S., "Understanding Center-Driven Web Winders," Power Transmission Design, April 1995
- B. T. Boulter, and H.W. Fox, "Advanced Dynamic Simulation," Internal ApICS LLC Training document.
- B. T. Boulter, "The Effect of Speed Loop Bandwidths on System Natural Frequencies in Multi-Zone Strip Processing Lines" , Transactions of the IEEE-IAS, pp. 126 - 134 Jan/Feb. 1999.
- B. T. Boulter, and Z. Gao, "A Real-Time Self-Tuning Web Tension Regulation Scheme," Real -Time Systems Journal, No. 11, 265-287, 1996
- B. T. Boulter, " Applying Drive Performance Specifications to Systems Applications – Part II, Torque/Current Regulation", Proceedings of the 36th IEEE IAS Conference, Chicago IL. Oct. 2001,
- Walton, B. and Rice, B. S., "Web Longitudinal Dynamics" Proceedings of 4th IWHC International Web Handling Conference, Oklahoma State University, June 1997.
- Astrom, K.J. and Hagglund, T., "Automatic Tuning of Simple Regulators with Specifications on Phase and Amplitude Margins" Automatica, Vol. 20, No.5, pp. 645-651, 1984.
- Lundh, M. and Astrom, K.J., "Automatics Initialization of a Robust Self-tuning Controller," Automatica, Vol. 30, No.11, pp. 1649-1662, 1994.
- Hagglund, T. and Astrom, K.J., "Industrial Adaptive Controllers Based on Frequency Response Techniques," Automatica, Vol. 27, No.4, pp. 509-609, 1994.
- Ho, W.K., C.C. Hang, W. Wojsnis, and Q.H. Tao, "Frequency Domain Approach To Self-Tuning PID Control," Control Engineering Practice, Vol.4, No.6, pp807-813, 1996.
- Schei, T.S., "Automatic Tuning of PID Controllers Based on Transfer Function Estimation," Automatica, Vol. 30, No.12, pp. 1983-1989, 1994.
- Lamaire, R.O., Valavani, L., Athans, M., and Stein, G., "A Frequency-domain Estimator for Use in Adaptive Control Systems," Automatica, Vol. 27, No.1, pp. 23-38, 1991.
- Voda, A. A. and Landau, I.D., "A Method for the Auto-calibration of PID Controllers," Automatica, Vol. 31, No.1, pp. 41-53, 1995.
- Tang, Y., "Adaptive Frequency Response Identification Using the Lagrange Filter," Automatica, Vol. 29, No.2, pp. 451-455, 1993.
- Explanation of per-normal quantities: http://www.apicsllc.com/apics/Misc/tricks.html#101/
- Clark, R. N., "Another Reason to Eschew Pole Zero Cancellation" , IEEE Control Systems Magazine, April. 1988. pp. 87-88.
|